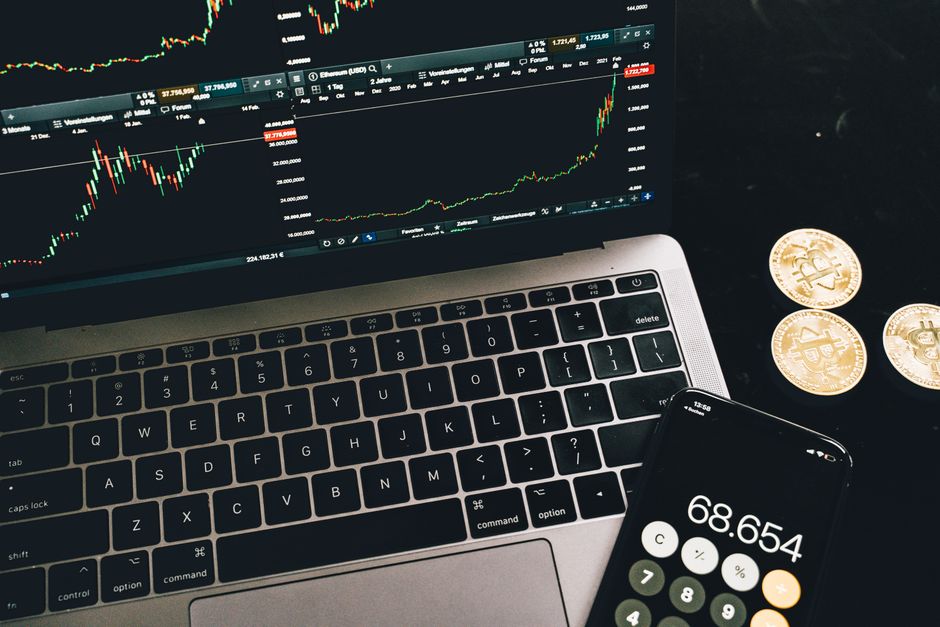
What a Crypto Price Chart Is Actually Telling You
If you’ve ever opened a crypto trading platform and felt instantly overwhelmed by lines, colored bars, and flashing numbers, you’re not alone. Learning **how to read crypto market charts for beginners** is the foundational skill that separates reactive, emotional trading from informed market analysis. A price chart is a visual translation of raw trading data — specifically price, time, and volume — compressed into a format the human eye can scan quickly.
The two most common chart types are the **line chart** and the **candlestick chart**. A line chart connects closing prices over time and is easy to read at a glance, but it discards a significant amount of information. The candlestick chart preserves four data points per period — the open, high, low, and close — making it the standard tool for serious [crypto market analysis](https://sieunjayd.blog/category/latest-news/market-analysis/).
Unlike stock markets, which close on weekends, **crypto markets run 24 hours a day, 7 days a week**. Before adding any indicator to a chart, beginners should understand **price action** — the raw movement of price over time — because that is the core signal everything else is built on.
—
The Anatomy of a Candlestick: The Core Unit of Chart Reading
Every candlestick represents a specific time period and encodes four key data points known as **OHLC: Open, High, Low, and Close**. The rectangular body shows the range between the open and close price. The thin lines extending above and below the body are called **wicks** (also referred to as shadows or tails), showing the highest and lowest price reached during that period.
- **Green (bullish) candle**: The close is higher than the open — buyers were in control.
- **Red (bearish) candle**: The close is lower than the open — s rs were in control.
- **Long wicks**: Suggest price tested an extreme level but was rejected, indicating indecision or reversal pressure.
- **Small body, long wicks**: Often signals uncertainty between buyers and s rs — sometimes called a **doji**.
One of the most common beginner mistakes is treating a single red candle as an urgent sell signal. A single candle is never a signal in isolation — **context across multiple candles** is what gives any individual bar meaning.
—
Timeframes Explained: Choosing the Right Chart View

A **timeframe** determines how much price data each candle represents. A 1-minute chart shows one candle per minute; a daily chart shows one candle per day. This choice dramatically affects what you see and the conclusions you draw.
A critical concept every beginner needs to internalize: **the same asset can look bullish on a 1-hour chart and bearish on a daily chart simultaneously**. Short timeframes are full of noise — random price fluctuations that don’t reflect meaningful market direction.
- **1-minute to 15-minute charts**: Used by active day traders; extremely noisy and high-stress.
- **1-hour to 4-hour charts**: Intermediate timeframes favored by swing traders.
- **Daily and weekly charts**: The most reliable starting point for long-term holders and beginners.
For beginners, defaulting to the **daily or weekly chart** reduces emotional overreaction and provides a cleaner picture of actual trend direction.
—
Volume: The Metric Most Beginners Ignore
**Trading volume** is the total quantity of an asset bought and sold within a given time period. On most charts, volume appears as vertical bars along the bottom, color-coded to match the corresponding candle. This metric is one of the most underused tools available to beginner chart readers.
Volume answers a simple but important question: *how much conviction is behind this price move?* A price increase accompanied by **high volume** suggests strong participation. The same increase on **low or falling volume** may indicate a weak move lacking broad support.
- **Volume spikes** often coincide with major news events or large institutional activity.
- **Declining volume** during a price rally can signal fading momentum.
- **Breakouts on high volume** are generally considered more meaningful than low-volume breakouts.
Learning to read volume alongside price — rather than treating them as separate data streams — is one of the fastest ways to improve your chart literacy.
—
Support and Resistance: Two Practical Concepts for Beginners
**Support** is a price level where historical buying pressure has been strong enough to prevent further decline. **Resistance** is the opposite — a level where selling pressure has historically capped upward movement. These two concepts are among the most practically useful in all of technical analysis (TA).
You don’t need any special indicator to identify support and resistance. On a chart, look for price levels where the asset has bounced multiple times, stalled, or reversed.
- Support and resistance are **zones**, not exact price points — expect some variation around key levels.
- When a support level is broken convincingly, it often **becomes new resistance** — a concept called role reversal.
- **False breakouts** occur when price briefly moves through a level before snapping back, trapping traders who acted on the break.
—
Introduction to Technical Indicators: Tools, Not Crystal Balls
**Technical indicators** are mathematical formulas applied to price or volume data to generate visual signals on a chart. They are tools for filtering noise — but they are **not predictive instruments**.
| Indicator | What It Measures | What It Shows |
|---|---|---|
| **Moving Average (MA)** | Average price over a set period | Smooths noise; shows trend direction |
| **RSI (Relative Strength Index)** | Momentum on a 0–100 scale | Overbought (>70) or oversold (<30) conditions |
| **MACD** (Moving Average Convergence Divergence) | Relationship between two moving averages | Trend direction and momentum shifts |
The most important caveat about all technical indicators: **they are lagging tools**. They are calculated from past price data, which means they confirm what has already happened — they do not predict what comes next.
—
Reading Market Trends: Uptrend, Downtrend, and Sideways
A **trend** is the general direction price is moving over a defined period. Identifying trend direction is one of the first things any analyst does before interpreting indicators or patterns.
- **Uptrend**: A series of **higher highs and higher lows** — each peak is above the last, and each pullback holds above the previous low.
- **Downtrend**: A series of **lower highs and lower lows** — each rally fails at a lower level, and each drop reaches a new low.
- **Sideways (range-bound) market**: Price oscillates between a defined support and resistance zone without establishing a clear directional bias.
Context is everything in trend analysis. For beginners, **trading against the dominant trend** carries significantly higher risk and lower probability of success.
—
Common Chart Patterns Beginners Should Recognize
A **chart pattern** is a recurring formation in price data that traders use to assess the probability of a future move. Patterns are probabilistic — no formation carries a 100% success rate.
- **Triangle patterns** (symmetrical, ascending, descending): Price compresses into a narrowing range, often preceding a directional breakout.
- **Head and shoulders**: A three-peak formation where the middle peak is highest; classically interpreted as a potential trend reversal signal.
- **Double top / double bottom**: Price tests the same level twice and fails to break through, suggesting the trend may be reversing.
Pattern recognition takes time and screen hours to develop. Beginners should study these formations on historical charts before drawing conclusions from live price action.
—
Market Sentiment and How It Shows Up on Charts
**Market sentiment** refers to the collective attitude of participants toward an asset — broadly, whether the crowd is fearful or greedy at a given moment. These cycles leave visible footprints in price and volume data.
The **Crypto Fear and Greed Index** aggregates signals like volatility, trading volume, and social media activity into a single 0–100 score. A score near 0 indicates extreme fear; near 100 signals extreme greed. While useful as background context, it has real limitations as a standalone trading tool.
**Off-chart events** — regulatory decisions, macroeconomic data releases, exchange hacks, or major institutional moves — can cause sharp price moves that no technical reading would have predicted. Effective [market analysis in the crypto space](https://sieunjayd.blog/category/latest-news/market-analysis/) pairs technical chart reading with awareness of the broader news and fundamental landscape.
—
Free Tools US Beginners Can Use to Practice Chart Reading
You don’t need a paid subscription to start learning chart analysis. Several free platforms give US-based beginners solid access to charting tools.
- **TradingView**: The most widely used charting platform globally; the free tier includes real-time crypto charts, basic indicators, and a large community of shared ideas.
- **CoinGecko and CoinMarketCap**: Both offer simple price history charts and volume data — ideal for quick reference and price context.
- **Exchange-native charts** (Coinbase, Kraken): Built-in chart tools are a practical starting point with no extra login required.
- **Paper trading**: Most platforms allow you to simulate trades without real capital — the safest way to practice without financial risk.
For a beginner chart setup, keep it simple: **candlestick view, volume bars, and one or two indicators maximum**. Overloading a chart with indicators creates noise, not clarity.
—
Checklist: Building Your First Crypto Chart Reading Habit
Use this quick-reference checklist as a structured starting framework.
- Switch to **candlestick view** on your platform of choice
- Set the timeframe to **daily or weekly** to reduce short-term noise
- Add a **volume panel** below the price chart
- Identify at least two visible **support and resistance zones**
- Add one **moving average** (20-day or 50-day is a common starting point)
- Note the **RSI reading** — is the asset in overbought or oversold territory?
- Check the broader **trend direction** before interpreting any single candle or indicator
- Cross-reference with recent **news or fundamental developments** before drawing conclusions
—
Investment Risk Disclaimer
This article is for **educational purposes only** and does not constitute financial advice, investment advice, or a recommendation to buy or sell any asset. Crypto markets are highly volatile — price can move sharply against any chart reading at any time. Past price behavior visible on a chart does not reliably predict future performance. No indicator, pattern, or analytical framework eliminates investment risk. US readers should consult a **licensed financial advisor** before making any investment decisions. All trading and investing involves risk of loss, including the possible loss of principal.
—
Frequently Asked Questions (FAQ)
Q: What is the best chart type for a complete beginner in crypto?
Most analysts recommend starting with **candlestick charts on a daily timeframe**. Candlesticks show more information than line charts (open, high, low, close), and the daily timeframe filters out short-term noise that overwhelms beginners. You can switch chart types on TradingView or CoinGecko in one click — look for the chart type selector in the top toolbar.
Q: How do I know if a crypto chart signal is reliable?
No single chart signal is fully reliable on its own. Analysts look for **signal confluence** — when multiple independent indicators or patterns point in the same direction simultaneously. Even with confluence, signals fail regularly. The correct response to signal uncertainty is disciplined **risk management**: appropriate position sizing and pre-defined stop-loss levels, not blind confidence in any single reading.
Q: Can I learn to read crypto charts without a math background?
Yes. The vast majority of chart reading is **visual pattern recognition**, not advanced mathematics. Indicators like RSI and moving averages can be understood conceptually without knowing the underlying formulas. Free resources like TradingView’s education section, CoinGecko’s learn pages, and community tutorials on YouTube offer self-paced chart literacy for complete beginners.
Q: How is crypto chart reading different from reading stock charts?
The core concepts — candlesticks, volume, support and resistance, trend direction — apply to both. The key differences are **market hours** (crypto trades 24/7, stocks do not), **volatility levels** (crypto moves are typically more extreme), and the influence of **crypto-specific events** like protocol upgrades, exchange listings, or on-chain data. Beginners who already understand stock charts will find crypto charting familiar in structure but more demanding in pace.
Q: What timeframe should a beginner start with?
The **daily chart** is the most recommended starting point for beginners. It reduces the emotional noise generated by short timeframes and gives a clearer picture of actual trend direction. As familiarity grows, beginners can layer in the 4-hour chart for more granular context — but the daily view should remain the primary reference frame.
Charting & Exchange Resources
| Platform | Use Case | Key Feature | Fee Model | Action |
|---|---|---|---|---|
| TradingView | Charting & technical analysis | Indicators, multi-timeframe charts | Free / Pro tiers | View Platform |
| Coinbase | Exchange (beginner-friendly) | Simple USD on-ramp, educational tools | Varies by region | View Platform |
| Binance | Exchange (advanced pairs) | Wide altcoin coverage, spot markets | Varies by region | View Platform |
Affiliate Disclosure: This post contains affiliate links. We may earn a commission if you buy through our links, at no extra cost to you. Investment Risk Disclaimer: Cryptocurrency and digital asset markets are highly volatile. This content is for informational and educational purposes only and is not financial, investment, or trading advice. You may lose some or all of your capital. Do your own research and consult a licensed financial advisor before making investment decisions.
Leave a Reply