
The cryptocurrency market moves in cycles, and understanding those cycles is the difference between making calculated moves and chasing hype. One tool that helps investors track where market leadership is rotating is the **Altcoin Season Index chart**, a data-driven indicator that measures whether Bitcoin or altcoins are leading the broader crypto market. Whether you are actively investing in cryptocurrency or simply monitoring the space as a spectator, this guide breaks down how the index works, what it tells you, and how to use it responsibly as part of a broader research process.
What Is Altcoin Season?
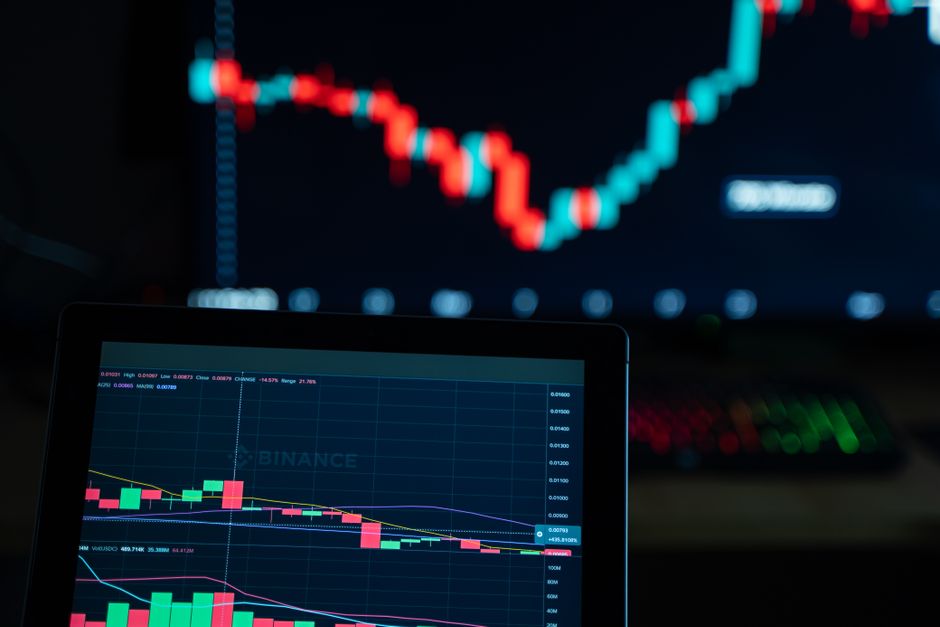
**Altcoin season** describes a market condition in which the majority of alternative cryptocurrencies outperform Bitcoin over a sustained period. Rather than Bitcoin driving all the gains, smaller-cap tokens catch speculative momentum and often deliver outsized returns relative to the flagship digital asset. This rotation is a natural part of how crypto market cycles play out historically.
The underlying mechanics are straightforward. When Bitcoin’s price action becomes overheated or consolidates sideways, traders and capital begin hunting for the next opportunity. That capital rotation typically flows into altcoins, pushing their collective prices higher. The phenomenon is visible in market data when the **BTC dominance chart** declines while the total altcoin market capitalization climbs simultaneously.
Not every altcoin season is identical. Some are brief, lasting only a few weeks, while others extend for months and produce generational wealth for early participants. The intensity depends on broader macroeconomic conditions, regulatory developments, and the overall sentiment cycle across the entire crypto market. Recognizing the signs early and understanding the underlying metrics is far more valuable than reacting after the move is already underway.
The term gained widespread usage in the retail trading community around 2017 during the last major bull cycle, and it has since become standard vocabulary among analysts tracking crypto market rotations. The Altcoin Season Index was developed specifically to quantify this phenomenon rather than leaving it to subjective interpretation.
How the Altcoin Season Index Chart Works
The **Altcoin Season Index (ASI)** is a numerical score that measures the relative performance of the top 50 cryptocurrencies compared to Bitcoin over a trailing 90-day window. The index ranges from 0 to 100, with specific thresholds that define current market conditions.
- **Score above 75:** Altcoin season is active — most altcoins are outperforming Bitcoin
- **Score between 25 and 75:** Neutral or mixed conditions
- **Score below 25:** Bitcoin season — Bitcoin is dominating returns
The 90-day lookback window was chosen deliberately. It is long enough to smooth out short-term price spikes and daily volatility that can distort shorter time frames, yet short enough to remain responsive to genuine shifts in market regime. Every day, the index recalculates using aggregated price data sourced from major exchanges to reduce the impact of any single platform’s liquidity or manipulation risk.
What the Score Does Not Tell You
No single metric perfectly predicts the future of any market, and the ASI is no exception. It reflects what has happened over the past 90 days rather than projecting forward momentum. This means the index can remain in “altcoin season” territory even as the market begins topping out, or it can signal caution while the best opportunities are still ahead. Use the ASI as one layer of analysis, not a standalone trading signal.
Supporting Metrics That Pair Well With the ASI
Most serious analysts do not rely on the ASI in isolation. Complementary tools include the **Total3 market cap** (which measures the combined value of all cryptocurrencies excluding Bitcoin and Ethereum), **DeFi total value locked (TVL)**, and **exchange exchange flow data**. When these metrics move in the same direction as the ASI, the signal is considerably more reliable than when they diverge.
Key Altcoin Market Trends Shaping 2025
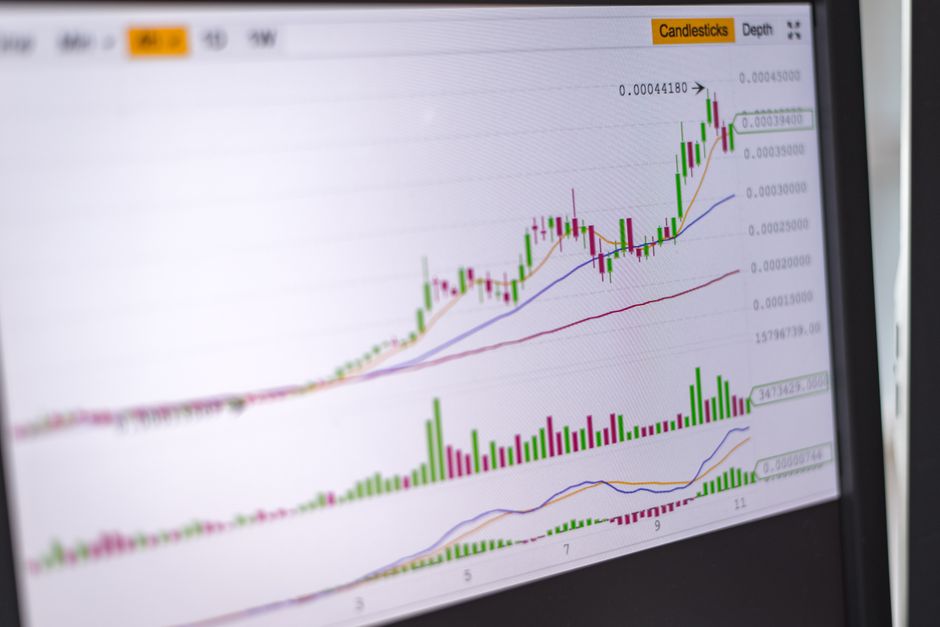
Several structural trends are currently influencing the altcoin market in ways that directly affect how the ASI should be interpreted. The approval of spot Bitcoin and Ethereum ETFs in the United States has brought significant institutional capital into the space, tightening correlations between major assets and altering historical seasonality patterns. More capital chasing a smaller set of regulated, liquid assets tends to compress volatility in the short term while creating longer-term structural tailwinds.
Layer-1 blockchain platforms continue competing for developer mindshare, and this infrastructure layer consistently attracts capital during altcoin seasons. Ethereum remains the dominant smart contract platform, but Solana, Avalanche, and several other competing chains have built genuine utility and ecosystem depth that investors should understand before allocating capital.
The AI crypto sector emerged as a notable narrative in the most recent cycle, with tokens tied to decentralized AI infrastructure attracting speculative interest. While the long-term utility of many AI-linked tokens remains unproven, narrative-driven capital rotation is a documented phenomenon in crypto markets and is reflected in how individual coins move relative to the ASI.
DeFi protocols continue functioning as the financial backbone of the altcoin ecosystem. Total value locked across decentralized exchanges, lending platforms, and liquidity protocols serves as a real-time proxy for actual usage demand, and this data point often leads price movements by weeks or months. Rising TVL alongside a climbing ASI is a materially different signal than rising prices in the absence of on-chain utility growth.
Reading the Altcoin Season Index Chart: Patterns to Watch
The ASI chart exhibits recurring visual patterns that experienced analysts use to contextualize current conditions. Understanding these patterns does not make predictions reliable, but it does help investors frame their expectations more accurately.
| ASI Zone | Market Condition | What It Historically Means |
|---|---|---|
| 0–25 | Bitcoin season | Capital concentrated in BTC; altcoins lagging significantly |
| 25–50 | Early accumulation | Mixed signals; leaders emerging but broad market unclear |
| 50–75 | Building momentum | Altcoins gaining share; BTC dominance plateauing |
| 75–100 | Full altcoin season | Broad altcoin outperformance; elevated speculative activity |
The most reliable early signal is not the index crossing into season territory, but rather the combination of the ASI climbing above 50 while the Bitcoin Dominance chart simultaneously declines. This dual confirmation has historically preceded the strongest altcoin rallies with the least amount of false signal noise. When only one metric confirms, proceed with additional caution.
Practical Strategies for Using ASI Data Responsibly
Translating chart data into investment decisions requires a structured approach. The ASI is most useful as a contextual input for portfolio rebalancing rather than a specific buy or sell trigger.
**Phase-based allocation strategy** involves systematically adjusting exposure based on ASI zones. When the index climbs above 75 and holds for several weeks, investors may consider incrementally increasing altcoin allocation. When it falls below 25, trimming altcoin exposure in favor of Bitcoin or stablecoins historically preserved capital during the harshest drawdowns.
**Position sizing discipline** is the most overlooked application of ASI data. Altcoins can swing 30 to 70 percent in a single week during volatile periods. Position limits of 3 to 5 percent per individual coin manage downside risk while keeping meaningful exposure to potential upside. Larger positions concentrate risk in a single catalyst, which is rarely advisable in any market.
**Sector rotation awareness** helps investors prioritize during extended altcoin seasons. Historical cycles show that DeFi and exchange tokens typically lead early, Layer-1 infrastructure follows mid-cycle, and gaming and NFT-related tokens often close out the season. Understanding this rotation sequence helps investors prioritize conviction bets rather than spreading capital evenly across unrelated sectors.
Risk Management in the Altcoin Market
Altcoin investing carries risks that are materially different from those of Bitcoin and Ethereum. Before deploying capital based on any indicator, including the ASI, investors must understand what they are actually taking on.
**Volatility risk** is the defining characteristic of the altcoin market. A coin that doubles in a week can lose 60 percent in the following two weeks. The Altcoin Season Index does not protect against this reality. In fact, the conditions that push the ASI above 75 are often the same conditions that create the most dramatic subsequent drawdowns.
**Liquidity risk** affects smaller-cap altcoins disproportionately. During market stress, bid-ask spreads widen and large orders can move prices significantly against a position. Exchange listing risk is a related concern: coins that lose their primary exchange listing often see catastrophic price declines with little warning.
**Project-specific risk** is distinct from market risk. Even during a strong altcoin season, individual projects can fail due to smart contract vulnerabilities, team abandonment, regulatory action, or simple lack of adoption. No chart indicator predicts which specific projects will survive and which will not.
**Tax implications** affect US investors who trade actively. Every altcoin-to-Bitcoin or altcoin-to-stablecoin trade may trigger a taxable event. Frequent rebalancing based on ASI readings can generate substantial short-term capital gains liability that erodes net returns, particularly in a volatile market where positions flip between gains and losses quickly.
Building a Crypto Portfolio Around Market Cycles
A resilient crypto portfolio begins with a clear allocation framework before the Altcoin Season Index delivers any signals. This framework should account for risk tolerance, investment time horizon, and overall portfolio size.
| Asset Class | Suggested Range | Rationale |
|---|---|---|
| Bitcoin (BTC) | 50–70% of crypto allocation | Highest liquidity, lowest volatility within crypto |
| Ethereum (ETH) | 15–25% of crypto allocation | Smart contract leader, staking yield potential |
| Altcoins | 10–30% of crypto allocation | Higher risk, higher growth potential during seasons |
The exact allocation within the altcoin segment should prioritize utility over narrative. Projects with genuine on-chain usage, real users, and transparent governance structures tend to retain value after speculative cycles end. Tokens with no functioning product and heavy social media promotion are frequent targets of pump-and-dump schemes regardless of what the ASI is signaling.
**Rebalancing discipline** matters more than timing precision. Whether you rebalance quarterly or when any allocation drifts more than 5 percentage points from its target, having a predetermined rule removes emotion from the process. Emotional decision-making during volatile altcoin seasons is one of the most reliable ways to buy high and sell low.
Macroeconomic and Regulatory Context
The ASI operates within a broader environment that shapes its reliability and interpretation. US regulatory actions by the Securities and Exchange Commission and the Commodity Futures Trading Commission directly affect which altcoins can list on regulated exchanges and how institutional investors can participate. Regulatory clarity, particularly around spot cryptocurrency ETF approvals beyond Bitcoin and Ethereum, will be a significant factor in how the next cycle develops.
Macroeconomic conditions influence the entire crypto market in ways that the ASI cannot capture. Rising interest rates tend to suppress speculative risk appetite, which historically weighs on altcoins more heavily than on Bitcoin. Inflation data, Federal Reserve policy, and US dollar strength all correlate with risk-on and risk-off rotations that affect the entire asset class simultaneously.
Understanding this broader context prevents the mistake of treating the ASI as an isolated indicator. Market cycles do not operate in a vacuum, and the most significant shifts in the Altcoin Season Index have historically coincided with recognizable macroeconomic turning points.
Key Takeaways and Final Thoughts
**Important risk disclosure:** Cryptocurrency investing involves substantial risk of loss. The Altcoin Season Index is an analytical tool, not a financial guarantee. Past performance does not indicate future results, and no single indicator should drive investment decisions. Always conduct your own independent research and consult a qualified financial advisor before making any investment decisions. This article is for informational purposes only and does not constitute financial or investment advice.
The Altcoin Season Index chart is one of the most practical tools available for tracking market rotations in the cryptocurrency space. It converts a vague, emotion-driven concept into a measurable data point that investors can track consistently over time. Used responsibly, alongside supporting on-chain metrics, fundamental research, and disciplined position sizing, it adds genuine analytical value to any crypto investment framework.
The most important principle for US retail investors to internalize is that no indicator beats sound risk management and genuine diversification. The ASI can help time entry points within a disciplined strategy, but it cannot replace the foundational work of understanding what you own, why you own it, and how much you can afford to lose if the thesis turns out to be wrong.
The US cryptocurrency market is evolving rapidly. Regulatory frameworks are tightening, institutional participation is growing, and new sectors like decentralized AI and real-world asset tokenization are creating novel investment categories. Investors who build their research process around reliable data, clear risk parameters, and ongoing education will be far better positioned to navigate whatever the next altcoin season brings.
Frequently Asked Questions (FAQ)
Q: What is the difference between an altcoin and Bitcoin?
An altcoin is any cryptocurrency other than Bitcoin. The term encompasses thousands of digital assets including Ethereum, Solana, Cardano, and countless smaller tokens built for specific use cases like decentralized finance, gaming, or data infrastructure. Bitcoin remains the largest cryptocurrency by market capitalization and is designed primarily as a store of value and peer-to-peer electronic cash system. Altcoins typically serve different functions, compete on different technological bases, and carry materially higher volatility and project-specific risk than Bitcoin.
Q: How often should investors check the Altcoin Season Index chart?
Checking the ASI on a weekly basis is sufficient for most strategic investors. The index uses a 90-day rolling calculation, so daily changes are mostly noise. Monitoring it weekly allows you to spot meaningful shifts in market regime without inducing reactive decision-making based on short-term fluctuations. Monthly reviews are also reasonable for long-term holders with multi-year time horizons.
Q: Can investing in altcoins be more profitable than investing in Bitcoin or Ethereum?
Historically, certain altcoins have delivered higher percentage returns than Bitcoin during specific market cycles. However, they have also experienced more severe drawdowns. The risk-return profile of altcoins is significantly more aggressive than Bitcoin or Ethereum, and past outperformance does not guarantee future results. Any allocation to altcoins should be sized conservatively within an overall portfolio strategy that prioritizes capital preservation alongside growth potential.
Charting & Exchange Resources
| Platform | Use Case | Key Feature | Fee Model | Action |
|---|---|---|---|---|
| TradingView | Charting & technical analysis | Indicators, multi-timeframe charts | Free / Pro tiers | View Platform |
| Coinbase | Exchange (beginner-friendly) | Simple USD on-ramp, educational tools | Varies by region | View Platform |
| Binance | Exchange (advanced pairs) | Wide altcoin coverage, spot markets | Varies by region | View Platform |
Affiliate Disclosure: This post contains affiliate links. We may earn a commission if you buy through our links, at no extra cost to you. Investment Risk Disclaimer: Cryptocurrency and digital asset markets are highly volatile. This content is for informational and educational purposes only and is not financial, investment, or trading advice. You may lose some or all of your capital. Do your own research and consult a licensed financial advisor before making investment decisions.
Leave a Reply