How to Read Crypto Market Charts: A Beginner’s Guide

What Crypto Market Charts Actually Show
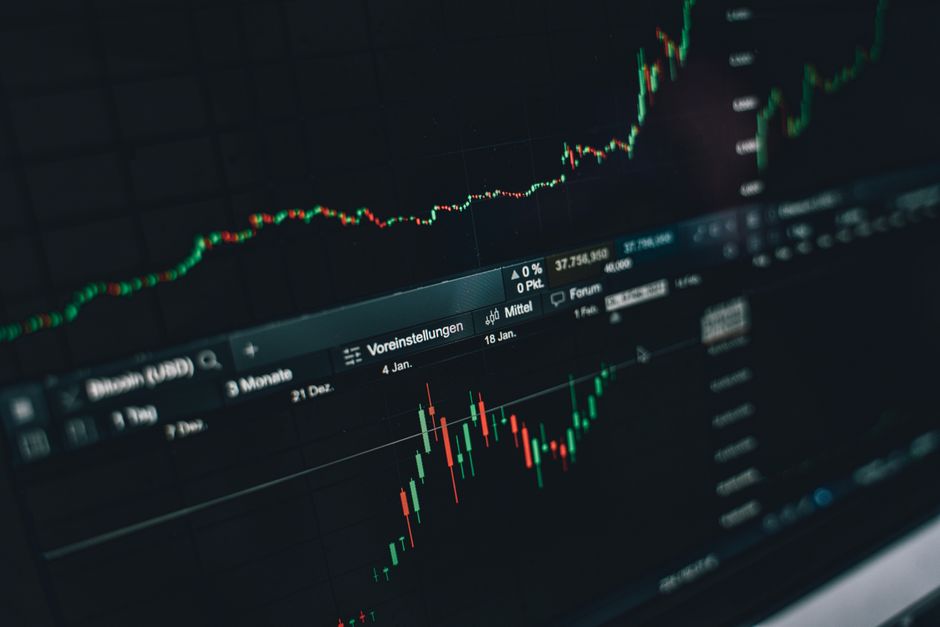
Crypto market charts display the historical trading activity of a digital asset — such as Bitcoin or Ethereum — over a chosen time period. Every chart plots two core variables: price on the vertical axis and time on the horizontal axis. Reading these charts correctly is one of the foundational skills for anyone looking to analyze cryptocurrency markets, whether you are actively trading or simply trying to understand market conditions. The chart type you select changes what information is emphasized, so beginners should start by understanding the three most common formats before diving deeper into indicators. Most US-based cryptocurrency exchanges offer these chart types by default, and free tools like TradingView allow you to practice without committing funds.

Candlestick Charts vs. Line Charts vs. Bar Charts
**Candlestick charts** are the industry standard for active crypto analysis because they encode four data points into a single visual element: the opening price, closing price, highest price, and lowest price for each time interval. A green or white candlestick means the close was higher than the open; a red or black candlestick means the close was lower. **Line charts** simplify this by connecting only the closing prices across each period, making broad trends easier to spot but stripping away granular price action. **Bar charts** (also called OHLC charts) display the same four data points as candlesticks but in a compact text format using vertical and horizontal tick marks. Beginners should practice reading candlestick charts first because the visual shape of each candle communicates market sentiment faster than numbers alone.
Key Metrics Every Chart Displays
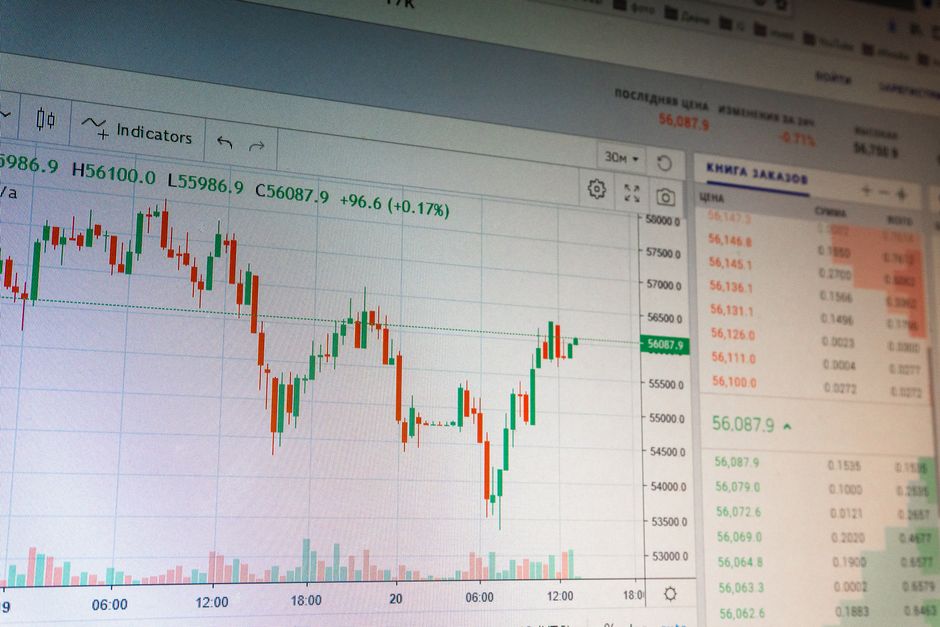
Every crypto chart includes several standard metrics that deserve your attention before you analyze anything else. **Trading volume** — shown as bars along the bottom of most chart interfaces — tells you how much of an asset changed hands during each period; high volume accompanying a price move signals stronger conviction behind that move. **Timeframe selection** determines the granularity of your view: a 1-minute chart shows intraday noise, a daily chart reveals medium-term trends, and a weekly or monthly chart paints the longer arc. **Market capitalization** and **24-hour price change** are typically displayed above the chart itself on exchange platforms. Understanding what each metric measures prevents the common beginner mistake of confusing volume spikes with trend confirmations or misreading short-term fluctuations as meaningful direction changes.
Reading Moving Averages on Crypto Charts
Moving averages smooth out price data to help you identify direction without getting distracted by day-to-day volatility. The **Simple Moving Average (SMA)** calculates the average closing price over a set number of periods — for example, a 50-day SMA adds up the last 50 closing prices and divides by 50. The **Exponential Moving Average (EMA)** applies more weight to recent prices, making it more responsive to new information. Most crypto traders watch for crossovers: when a shorter-term moving average crosses above a longer-term one, it can signal potential upward momentum, and the reverse can indicate weakening conditions. These signals are probabilistic tools, not guarantees, and they work best when combined with other indicators rather than used in isolation.
Support, Resistance, and Trend Lines
**Support** refers to a price level where a digital asset has historically attracted buying interest and bounced upward; **resistance** is the opposite — a ceiling where selling pressure has repeatedly pushed prices back down. Drawing horizontal lines at these levels on your chart creates a visual roadmap of where price action has stalled or reversed in the past. **Trend lines** connect a series of higher lows in an uptrend or lower highs in a downtrend, giving you a diagonal reference point for market direction. When a price breaks decisively above a resistance level or below a support level on high volume, technical analysts call this a **breakout** — though beginners should verify breakouts with additional indicators before acting, because false breakouts are common in crypto markets. Understanding these concepts helps you set more informed entry and exit targets without relying on gut feelings alone.
Relative Strength Index (RSI) and Momentum
The **Relative Strength Index (RSI)** measures how quickly a crypto asset’s price is changing to determine whether it is overbought or oversold. RSI is displayed as a separate line chart below the main price chart and ranges from 0 to 100; readings above 70 traditionally suggest an asset may be overbought, while readings below 30 may indicate oversold conditions. However, in strongly trending markets — which cryptocurrency markets frequently experience — RSI can remain overbought or oversold for extended periods. That is why RSI works best as a confirmation tool alongside trend analysis rather than as a standalone signal to buy or sell. Monitoring RSI alongside moving averages gives you a more complete picture of both momentum and direction.
Volume Analysis and Market Confirmation
Volume is the engine that powers price moves, and ignoring it is one of the most frequent mistakes new chart readers make. A price increase on low volume is less convincing than the same move accompanied by a volume surge, because it suggests fewer participants are driving the change. **On-balance volume (OBV)** is a cumulative indicator that adds volume on up days and subtracts it on down days, helping you see whether money is flowing into or out of an asset over time. When price and OBV diverge — meaning price rises while OBV falls — it can be an early warning sign that the upward move lacks institutional support. Most free charting platforms display volume bars by default, so make it a habit to check whether a price move is backed by genuine participation before treating it as a reliable signal.
Risk Management Principles for Chart Readers
Understanding chart patterns and indicators is only half the battle; managing risk is what keeps you in the market long enough for analysis to matter. **Position sizing** means deciding how much of your total portfolio to allocate to any single trade — a common rule of thumb for crypto is to risk no more than 1–2% of your portfolio on a single position. **Stop-loss orders** automatically close a position if price falls to a level you specify, limiting losses on trades that do not go as planned. **Take-profit targets** serve the opposite function, locking in gains when a chart pattern reaches your estimated objective. No chart reading strategy eliminates risk entirely; cryptocurrency markets are notoriously volatile, and even professional analysts with years of experience misread signals regularly. Treating chart analysis as a tool for improving decision-making probability — not a crystal ball — is the mindset that serves beginners best over the long term.
Practical Steps to Start Reading Charts Today
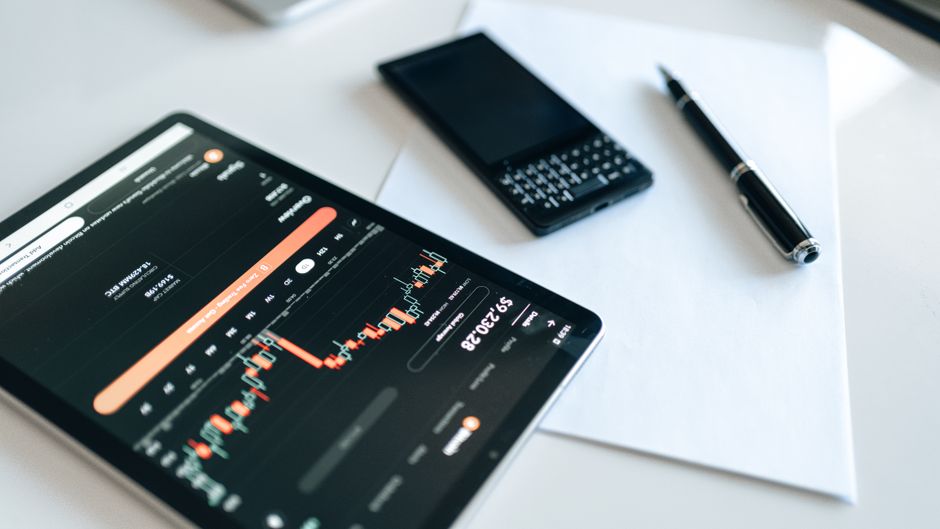
You do not need expensive software or a financial advisor to begin analyzing crypto charts right now. First, create a free account on a charting platform such as TradingView, which offers professional-grade tools at no cost and includes a broad library of crypto pairs. Second, spend time customizing a single chart — add a 50-day EMA, a 200-day EMA, and volume bars — and practice identifying whether the short average is above or below the long average. Third, pull up historical price action for Bitcoin and Ethereum on a daily timeframe and trace the support and resistance levels you observe. Fourth, keep a simple trading journal noting what the chart showed, what you expected to happen, and what actually occurred — this habit builds self-awareness faster than any indicator. Commit to one focused session per week, and you will likely develop meaningful chart fluency within a month or two.
Common Beginner Mistakes to Avoid

New chart readers tend to overload their analysis with too many indicators at once, which creates conflicting signals and decision paralysis. Stick to two or three tools — such as a moving average, RSI, and volume — until you understand how each one behaves on its own. Another frequent error is cherry-picking timeframes that support a desired conclusion; always check multiple timeframes to get a balanced view. Finally, many beginners mistake a trending market for a safe one — just because Bitcoin or Ethereum is climbing does not mean the risk of loss is lower; uptrends can reverse violently, and leverage amplifies losses just as much as gains. Approaching charts with int ctual humility and a willingness to be wrong protects your capital while you build real skills.
FAQ: Reading Crypto Market Charts
**What is the best chart type for beginners?**
Candlestick charts are generally the best starting point because they display the most information — open, high, low, and close — in a visually intuitive format. Most cryptocurrency exchanges default to candlestick views for this reason.
**Do I need to pay for charting software?**
No. Free platforms such as TradingView and the basic charting tools built into exchanges like Coinbase and Kraken provide sufficient functionality for most beginner and intermediate chart analysis needs.
**How do I know if a chart signal is reliable?**
No single indicator produces reliable signals consistently. Experienced traders confirm signals across multiple indicators, check volume for conviction, and always use risk management tools such as stop-loss orders regardless of how confident a signal appears.
**What timeframe should I use for crypto charts?**
Day traders often use 15-minute or 1-hour charts, while long-term investors typically rely on daily or weekly charts. Beginners benefit most from starting with daily charts to filter out short-term noise and focus on clear trends.
**Can I predict crypto prices from charts?**
No. Charts display historical data and can highlight patterns, trends, and probabilities, but they cannot predict future prices with certainty. All chart-based analysis involves interpreting likelihoods, not certainties.
**Disclaimer:** Cryptocurrency markets are highly volatile and carry substantial risk of loss. Charts and technical indicators do not guarantee outcomes and should not be interpreted as financial advice. Always consult a qualified financial professional before making investment decisions. Never invest more than you can afford to lose.
**Internal Links:**
Charting & Exchange Resources
| Platform | Use Case | Key Feature | Fee Model | Action |
|---|---|---|---|---|
| TradingView | Charting & technical analysis | Indicators, multi-timeframe charts | Free / Pro tiers | View Platform |
| Coinbase | Exchange (beginner-friendly) | Simple USD on-ramp, educational tools | Varies by region | View Platform |
| Binance | Exchange (advanced pairs) | Wide altcoin coverage, spot markets | Varies by region | View Platform |
Affiliate Disclosure: This post contains affiliate links. We may earn a commission if you buy through our links, at no extra cost to you. Investment Risk Disclaimer: Cryptocurrency and digital asset markets are highly volatile. This content is for informational and educational purposes only and is not financial, investment, or trading advice. You may lose some or all of your capital. Do your own research and consult a licensed financial advisor before making investment decisions.