How to Read Crypto Market Charts for Beginners


Understanding Crypto Market Charts
Learning **how to read crypto market charts for beginners** is one of the most practical skills any new investor can develop. Charts are the primary language of markets — they translate millions of individual buy and sell decisions into a visual story you can study and act on. Without this foundation, navigating the cryptocurrency market is essentially guesswork.

Three main chart types appear across most crypto trading platforms: **line charts**, **bar charts**, and **candlestick charts**. Line charts connect closing prices over time and give a clean, simple view of long-term direction. Bar and candlestick charts add open, high, and low price data, giving traders a far richer picture of each trading period.
Reading a basic chart starts with the axes. The horizontal (X) axis represents time — minutes, hours, days, or weeks depending on your selected timeframe. The vertical (Y) axis shows price. Every data point on the chart answers one simple question: *What was the price at this moment in time?*
For those just starting out, exploring a dedicated market analysis resource alongside a live charting platform can accelerate the learning curve considerably.
Technical Analysis Essentials
**Technical analysis (TA)** is the discipline of evaluating assets by studying historical price and volume data rather than underlying fundamentals. In crypto markets, TA is widely used because on-chain assets often lack traditional valuation metrics like earnings or dividends. Patterns in price movement become one of the few available signals.
Four concepts form the bedrock of TA:
- **Support**: A price level where buying pressure has historically stopped a decline
- **Resistance**: A price level where selling pressure has historically stopped a rally
- **Trend lines**: Diagonal lines drawn across successive highs or lows to visualize direction
- **Trading ranges**: Horizontal zones where price oscillates between a defined support and resistance
Identifying potential entry and exit points requires context, not certainty. When price approaches a known support level with declining sell volume, some traders interpret that as a potential reversal zone. When price repeatedly fails to break through resistance, that level may signal accumulated selling pressure. Neither scenario guarantees any outcome — market conditions shift constantly.
Candlestick Charts and Patterns

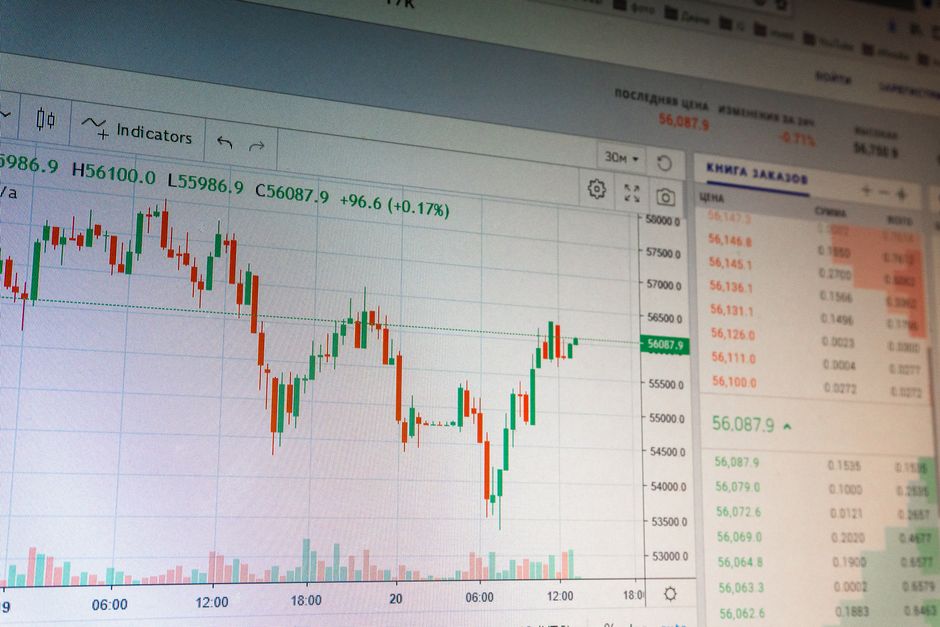
**Candlestick charts** originated in 18th-century Japan and remain the dominant chart format used by crypto traders worldwide. Each candle summarizes four data points for a given time period: the **open**, **high**, **low**, and **close** prices. The wide body represents the range between open and close; the thin lines extending above and below — called **wicks** or **shadows** — represent the high and low extremes.
Color coding tells you direction at a glance. A **green (bullish) candle** means the closing price was higher than the opening price. A **red (bearish) candle** means the closing price was lower.
Common patterns traders watch for include:
- **Doji**: Open and close are nearly equal, signaling market indecision
- **Hammer**: Small body with a long lower wick, often appearing near support
- **Engulfing pattern**: One candle’s body fully contains the previous candle’s body, suggesting a potential reversal
No single candlestick pattern is a reliable trade signal on its own. Patterns carry more analytical weight when they align with other indicators and appear at historically significant price levels.
Trading Volume and Its Significance
**Trading volume** measures the total number of units of a cryptocurrency exchanged within a given time period. It is displayed as a bar chart along the bottom of most trading interfaces. Volume is often called the “fuel” of price moves — it tells you whether a trend has conviction behind it or is likely to fizzle.
Here’s how to interpret volume patterns:
- **Rising price + rising volume**: Suggests strong buyer participation — the trend may be sustainable
- **Rising price + falling volume**: Suggests weakening momentum — the move may be running out of buyers
- **Sharp price drop + massive volume spike**: Often indicates a climactic sell-off that can precede stabilization
- **Low overall volume**: Signals low liquidity — prices can move sharply on relatively small trades
Beginners frequently focus exclusively on price and overlook volume entirely. Volume provides the context that separates a meaningful price move from random noise. Always cross-check volume when evaluating any chart pattern or indicator signal.
Moving Averages and Their Role
A **moving average (MA)** smooths out price data by calculating the average price over a defined number of periods. This reduces short-term volatility noise and helps traders identify the underlying direction of a trend. Moving averages are among the most widely cited indicators in financial analysis.
| Type | How It Works | Best Used For |
|---|---|---|
| **Simple Moving Average (SMA)** | Equal weight to all periods in the range | Identifying broad trend direction |
| **Exponential Moving Average (EMA)** | More weight given to recent prices | Reacting faster to recent price changes |
Popular configurations include the **50-day MA** and **200-day MA**. When a shorter-term MA crosses above a longer-term MA, some analysts refer to it as a **”golden cross”** — interpreted as a potential bullish signal. The reverse is called a **”death cross.”** These labels describe historical patterns; they do not guarantee future price movement in any market.
Oscillators and Indicators

**Oscillators** are mathematical indicators that fluctuate within a defined range and help traders assess whether an asset may be **overbought** or **oversold**. They are most useful in sideways, range-bound markets.
Two oscillators dominate crypto chart analysis:
- **RSI (Relative Strength Index)**: Measures the speed and magnitude of recent price changes on a scale of 0–100. Readings above 70 are conventionally considered overbought; readings below 30 are oversold. The RSI is a momentum gauge, not a buy or sell trigger.
- **MACD (Moving Average Convergence Divergence)**: Plots the relationship between two EMAs and includes a signal line. When the MACD line crosses above the signal line, some analysts interpret it as building bullish momentum. Divergence between MACD and price action is also closely watched.
Both tools have significant limitations in trending markets where assets can remain overbought or oversold for extended periods. Oscillators work best alongside price action analysis, not as standalone signals.
Chart Patterns Every Trader Should Know
**Chart patterns** are recurring formations in price action that technical analysts study as potential indicators of future market direction. They emerge from the collective psychology of buyers and s rs and appear across timeframes and asset classes.
Key patterns beginners should recognize:
- **Ascending triangle**: Flat resistance top with rising support — often interpreted as bullish accumulation
- **Descending triangle**: Flat support bottom with falling resistance — often interpreted as bearish distribution
- **Symmetrical triangle**: Converging trend lines — signals a potential breakout in either direction
- **Head and shoulders**: Three peaks with the middle peak being the highest — classically interpreted as a trend reversal
- **Double top / double bottom**: Price tests the same level twice and reverses — potential reversal signals
- **Flags and pennants**: Short consolidation patterns within a trend, sometimes followed by continuation
Recognizing these patterns requires practice. Most platforms offer paper trading — simulated trading with no real money at risk — which is the safest way to build pattern recognition skills without financial exposure. Consistent daily chart review, even just 15 minutes, accelerates recognition faster than most courses.
—
Risk Disclaimer
**Cryptocurrency markets are highly volatile and speculative.** The value of digital assets can decline rapidly and dramatically, including to zero. Nothing in this article constitutes financial, investment, or trading advice. Chart patterns and technical indicators are analytical tools — they do not predict future price movements with certainty. Past performance of any asset or indicator is not indicative of future results. Always conduct your own due diligence and consult a licensed financial advisor before making investment decisions. Only invest capital you can afford to lose entirely.
—
Frequently Asked Questions (FAQ)
Q: What is the difference between a bullish and bearish market chart pattern?
A: A **bullish pattern** suggests buying pressure may be building — price action forms higher lows or breaks through resistance. A **bearish pattern** suggests selling pressure may be building — price forms lower highs or fails to hold support. Neither pattern is a guaranteed predictor; both require confirmation from volume and other indicators before acting.
Q: How can beginners practice reading market charts?
A: Most major cryptocurrency exchanges offer **paper trading** or demo accounts where you can study real market charts and place simulated trades without risking real money. Tools like TradingView also provide free charting with full technical indicator access. Consistent daily chart review — even just 15 minutes — accelerates pattern recognition faster than most courses.
Q: What are some common mistakes beginners make when reading market charts?
A: The three most common errors are: **overloading charts** with too many indicators at once (which creates conflicting signals), **ignoring volume** and treating price action as the only data source, and **confirmation bias** — seeing the pattern you want to see rather than what the chart actually shows. Starting with one or two indicators and mastering them before adding more is the approach most experienced analysts recommend.
Q: Do chart patterns and indicators work reliably in the crypto market?
A: No analytical tool produces reliable signals consistently. Crypto markets are younger, less regulated, and more susceptible to manipulation than traditional financial markets. Chart patterns and indicators should always be used as part of a broader analysis framework — never as standalone buy or sell triggers.
Charting & Exchange Resources
| Platform | Use Case | Key Feature | Fee Model | Action |
|---|---|---|---|---|
| TradingView | Charting & technical analysis | Indicators, multi-timeframe charts | Free / Pro tiers | View Platform |
| Coinbase | Exchange (beginner-friendly) | Simple USD on-ramp, educational tools | Varies by region | View Platform |
| Binance | Exchange (advanced pairs) | Wide altcoin coverage, spot markets | Varies by region | View Platform |
Affiliate Disclosure: This post contains affiliate links. We may earn a commission if you buy through our links, at no extra cost to you. Investment Risk Disclaimer: Cryptocurrency and digital asset markets are highly volatile. This content is for informational and educational purposes only and is not financial, investment, or trading advice. You may lose some or all of your capital. Do your own research and consult a licensed financial advisor before making investment decisions.
