How to Read Crypto Market Charts for Beginners

{## How to Read Crypto Market Charts for Beginners: A Practical Guide to Cryptocurrency Market Analysis
If you’ve ever stared at a crypto price chart and felt completely lost, you’re not alone. Learning **how to read crypto market charts for beginners** is one of the most practical skills any US investor entering the digital asset space can develop. Cryptocurrency market analysis is the practice of studying price data, trading volume, and market trends to better understand what forces are currently driving an asset — and what historical behavior may reveal about present conditions.
This guide focuses on **technical analysis (TA)** — the study of historical price action using charts and statistical indicators. TA doesn’t guarantee future results, but it gives you a structured framework for interpreting market behavior. Combined with fundamental research, it forms the core toolkit of most serious crypto market participants.

One critical point before diving in: crypto markets are highly volatile, operate 24/7, and carry substantial financial risk. Nothing in this article is financial advice. Always conduct your own research and consult a licensed financial professional before making any investment decisions.
—
Understanding the Basic Chart Types
Crypto charting platforms display price data in several formats. The three most common are **line charts**, **bar charts**, and **candlestick charts**.
- **Line charts** connect closing prices over time — clean and simple, but they obscure intraday price swings.
- **Bar charts** (also called OHLC charts) display the open, high, low, and close for each time period in a vertical bar format.
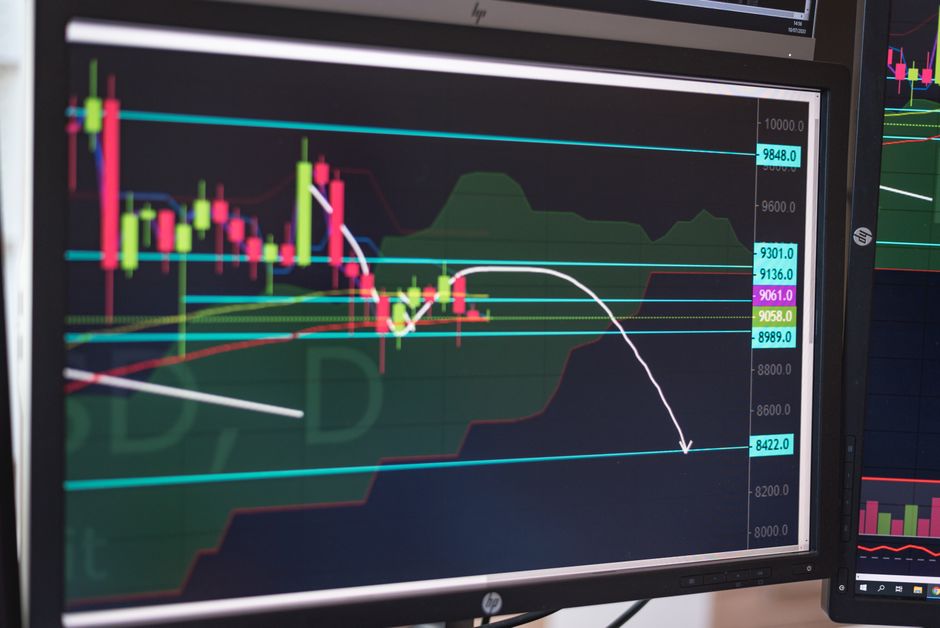
- **Candlestick charts** convey the same OHLC data visually using colored “candles” — green (or white) for bullish periods when price closed higher, red (or black) for bearish periods when it closed lower.
Candlestick charts are the dominant format in crypto because they pack the most information into each data point. Each candle’s **body** shows the range between open and close, while the thin lines above and below — called **wicks** or **shadows** — show how far price traveled beyond that range during the period.
**Time frames** matter enormously. A 1-hour chart shows 24 candles per day; a daily chart shows one candle per day. Short-term traders typically study 15-minute or 1-hour charts, while longer-term investors focus on daily, weekly, or monthly views. Most analysts recommend aligning your chart time frame with your intended holding period.
—
Trends, Support, and Resistance: The Foundation of Chart Reading
The most fundamental concept in technical analysis is the **trend** — the general direction price is moving over a given period:
- **Uptrend (bullish):** A series of higher highs and higher lows.
- **Downtrend (bearish):** A series of lower highs and lower lows.
- **Sideways (ranging):** Price oscillates between a horizontal ceiling and floor without clear directional momentum.
**Trend lines** are drawn by connecting two or more swing lows in an uptrend (or swing highs in a downtrend). When price touches a trend line and bounces, it suggests the trend remains intact. A **channel** forms when a parallel line is drawn on the opposite side, defining a price corridor.
**Support and resistance** are arguably the most actionable concepts for beginners. A **support level** is a price zone where buying interest has historically been strong enough to halt further decline — effectively a floor. A **resistance level** is the inverse: a ceiling where selling pressure has historically stalled upward moves. When a resistance level is broken convincingly, it often “flips” and becomes new support — a concept called **role reversal**.
Common chart patterns that form around these levels include:
- **Triangles** (ascending, descending, symmetrical) — consolidation phases before a potential breakout.
- **Flags and pennants** — brief pauses within a strong trend.
- **Head and shoulders** — a reversal pattern with a left shoulder, peak (head), and right shoulder.
- **Double tops / double bottoms** — price tests the same level twice and reverses direction.
No chart pattern is a guaranteed signal. Always confirm with additional data — especially volume — before drawing conclusions. For a broader look at how these patterns play out across different market conditions, ongoing crypto market analysis coverage tracks real-world pattern behavior across major assets.
—
Trading Volume and Volatility: What the Numbers Behind Price Reveal
**Trading volume** is the total number of units of an asset traded over a given period. Displayed as a bar graph at the bottom of most charts, it is one of the most underappreciated tools for beginners.
Volume confirms or questions price moves:
- A breakout above resistance on **high volume** is generally considered more credible than one on thin volume.
- A rally on **declining volume** may signal weakening momentum — sometimes called a “distribution” phase where experienced participants sell into retail buying.
- Volume spikes during selloffs can indicate **capitulation** — a final rush of panic selling that sometimes precedes a reversal.
**Volatility** measures how dramatically and rapidly price fluctuates. In crypto, volatility is extreme compared to traditional asset classes. The **Average True Range (ATR)** indicator quantifies volatility by measuring average price movement over a defined number of periods. High ATR readings signal turbulent conditions; low ATR suggests compression that often precedes a significant move.
**Bollinger Bands** are another common volatility tool — two standard deviation bands plotted around a moving average. When the bands narrow (a “squeeze”), it signals low volatility and potential breakout setup. When they widen, volatility is actively expanding.
| Indicator | What It Measures | Beginner Usefulness |
|---|---|---|
| Volume Bars | Buying/selling activity | High — confirms price moves |
| ATR | Price range volatility | Medium — useful for position sizing |
| Bollinger Bands | Volatility & price extremes | Medium — good for spotting squeezes |
| RSI | Momentum / overbought-oversold | High — visually intuitive |
| MACD | Trend momentum shifts | Medium — requires practice |
The **RSI (Relative Strength Index)** deserves particular attention. It oscillates between 0 and 100 and is used to identify overbought conditions (above 70) and oversold conditions (below 30). It’s one of the most beginner-accessible momentum indicators available on virtually every major charting platform.
The **MACD (Moving Average Convergence Divergence)** tracks the relationship between two exponential moving averages and is used to spot potential trend momentum shifts — a useful complement to RSI once you’re comfortable with the basics.
—
Fundamental Analysis: The Context Behind the Chart
Technical analysis tells you *how* price is moving; **fundamental analysis (FA)** attempts to explain *why* and whether an asset has underlying value worth that price. For crypto, FA involves evaluating:
- **Technology:** Is the blockchain solving a real problem? What are its speed, scalability, and security characteristics?
- **Team and development activity:** Is the core team credible? Is the open-source codebase actively maintained?
- **Tokenomics:** What is the total and circulating supply, emission schedule, and token utility? Inflationary tokenomics can suppress long-term price performance even during bull markets.
- **Adoption and ecosystem:** How many users, developers, and real-world integrations does the network support?
- **US regulatory environment:** Regulatory clarity — or the lack of it — from agencies like the **SEC (Securities and Exchange Commission)** and **CFTC (Commodity Futures Trading Commission)** directly affects institutional participation and liquidity.
FA and TA work best together. A technically bullish chart setup on a project with weak fundamentals presents a very different risk profile than the same setup on a network with strong developer activity and growing real-world usage.

—
Key Technical Indicators Every Beginner Should Know
Beyond RSI and MACD, a few additional indicators appear consistently across professional crypto analysis:
- **Moving Averages (MA):** The **Simple Moving Average (SMA)** and **Exponential Moving Average (EMA)** smooth out price data over a defined period, making trends easier to identify. The 50-day and 200-day moving averages are widely watched reference points. When the 50-day MA crosses above the 200-day MA, it’s called a **”golden cross”** — historically a bullish signal. The inverse is a **”death cross.”**
- **Fibonacci Retracement:** Based on the Fibonacci sequence, this tool identifies potential support and resistance levels at key percentage retracements (23.6%, 38.2%, 61.8%) from a prior significant move. Many traders use these levels to identify potential entry or exit zones.
- **On-chain metrics:** Unique to crypto, on-chain data — such as active wallet addresses, exchange inflows/outflows, and miner activity — can provide insight into network health and large-holder behavior that price charts alone don’t reveal.
—
How US Regulatory Context Affects Chart Behavior
For US-based readers, regulatory developments are not background noise — they are market-moving events. Announcements from the SEC, CFTC, or Congress regarding crypto classification, ETF approvals, or exchange enforcement actions have historically caused sharp, sudden price dislocations that no technical indicator could have predicted.
This means chart reading must be paired with awareness of the regulatory calendar. A technically clean support level can be shattered in minutes by an adverse regulatory headline. Conversely, positive regulatory clarity — such as the approval of a Bitcoin spot ETF — can trigger rapid breakouts beyond established resistance.
Tracking the latest regulatory and macro market analysis alongside your chart study is a practical habit for any US investor navigating the crypto space.
—
Risk Management: The Skill That Matters More Than Chart Reading
Crypto markets have produced both extraordinary gains and devastating losses. **Risk management** — not pattern recognition — is what separates sustainable participants from those who exhaust their capital.
Core principles every beginner should internalize:
- **Position sizing:** Never allocate more to a single asset than you can afford to lose entirely. Many experienced traders risk no more than 1–2% of total capital on any single trade.
- **Stop-loss orders:** A stop-loss automatically exits a position if price falls to a predetermined level, removing emotion from the exit decision.
- **Diversification:** Spreading exposure across uncorrelated assets reduces single-asset risk — though note that in severe crypto market downturns, most digital assets tend to correlate heavily.
- **Avoid leverage as a beginner:** **Leveraged trading** amplifies both gains and losses. A 10x leveraged position is fully liquidated with a 10% adverse price move. Leverage has erased entire account balances in minutes for unprepared traders.
- **Dollar-cost averaging (DCA):** Investing a fixed dollar amount at regular intervals — regardless of current price — reduces the emotional burden of market timing and smooths out entry cost over time.
—
> **Risk Disclaimer:** Cryptocurrency investments are highly speculative and subject to extreme volatility. Past price performance is not indicative of future results. The content in this article is for educational purposes only and does not constitute financial, investment, legal, or tax advice. Consult a qualified financial professional before making any investment decisions.
—
Frequently Asked Questions (FAQ)
Q: What does it mean to “read” a crypto chart?
A: Reading a crypto chart means interpreting price data, volume, and technical indicators to understand how an asset has behaved historically and what market forces may currently be at work. It does not mean predicting the future — it means building a structured, evidence-based view of present market conditions.
Q: What are the most common mistakes beginners make when reading crypto charts?
A: The most frequent errors are over-relying on a single indicator, focusing exclusively on short time frames (which are noisier and less reliable), and ignoring trading volume when evaluating breakouts. Many beginners also act on chart patterns before waiting for confirmation — a pattern only carries analytical weight once price actually responds to it.
Q: Which charting platform is best for beginners learning crypto technical analysis?
A: **TradingView** is the most widely used platform among both beginners and professionals, offering a clean interface, a large library of built-in indicators, and a free tier that covers most beginner needs. Most major US crypto exchanges — including Coinbase Advanced and Kraken — also embed charting tools directly in their trading interfaces.
Q: How long does it take to get competent at reading crypto market charts?
A: Most analysts suggest that consistent daily practice over 3–6 months builds genuine chart literacy. The key is **deliberate practice**: reviewing charts after the fact to test whether your analysis matched what actually happened, rather than only studying charts in real time. Keeping a trading journal — even a simple one — accelerates the learning curve significantly.
Q: Is technical analysis reliable for crypto markets?
A: TA is a widely used analytical framework, but it is not a predictive science. Crypto markets are especially susceptible to sudden news events, regulatory announcements, and liquidity gaps that can invalidate technical setups instantly. Most experienced analysts use TA as one input among several — not as a standalone decision-making system.
Q: Should beginners use leverage when trading crypto?
A: No. Leverage dramatically increases both potential gains and losses, and even modest adverse price moves can result in complete account liquidation. Most risk management frameworks recommend that beginners avoid leveraged products entirely until they have developed consistent chart reading skills and a disciplined risk management approach over an extended period.
Charting & Exchange Resources
| Platform | Use Case | Key Feature | Fee Model | Action |
|---|---|---|---|---|
| TradingView | Charting & technical analysis | Indicators, multi-timeframe charts | Free / Pro tiers | View Platform |
| Coinbase | Exchange (beginner-friendly) | Simple USD on-ramp, educational tools | Varies by region | View Platform |
| Binance | Exchange (advanced pairs) | Wide altcoin coverage, spot markets | Varies by region | View Platform |
Affiliate Disclosure: This post contains affiliate links. We may earn a commission if you buy through our links, at no extra cost to you. Investment Risk Disclaimer: Cryptocurrency and digital asset markets are highly volatile. This content is for informational and educational purposes only and is not financial, investment, or trading advice. You may lose some or all of your capital. Do your own research and consult a licensed financial advisor before making investment decisions.