
Understanding Altcoin Season
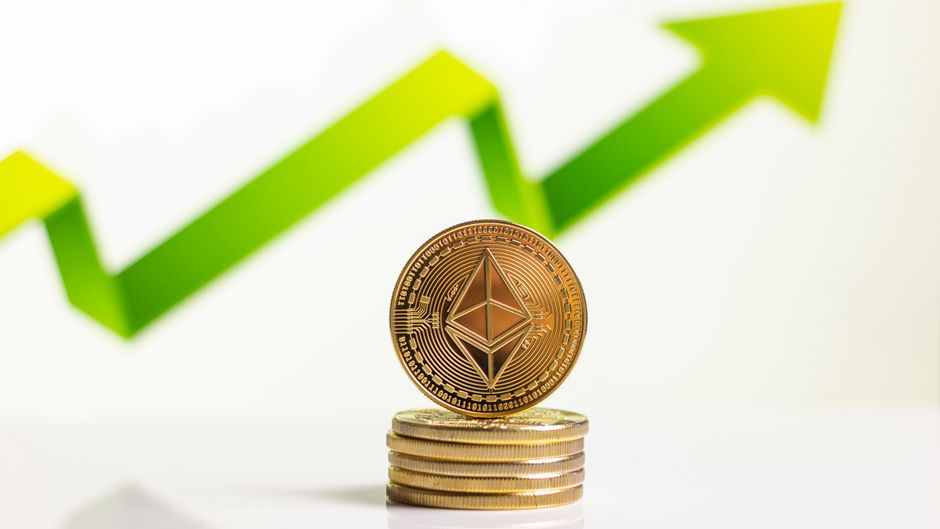
Altcoin season refers to periods when alternative cryptocurrencies outperform Bitcoin in terms of price gains and market momentum. During these cycles, capital flows from Bitcoin into smaller-cap digital assets, driving significant price appreciation across the altcoin market. Understanding these cycles is crucial for investors seeking to maximize returns while managing the inherent volatility of cryptocurrency markets.
Market cycles in crypto follow distinct patterns of accumulation, growth, distribution, and decline. Altcoin seasons typically emerge during the later stages of Bitcoin bull runs when investors rotate profits into higher-risk, higher-reward assets. These periods can last weeks or months, creating opportunities for substantial gains alongside elevated risk exposure.
Recognizing market trends through data-driven tools helps investors time entries and exits more effectively. The cyclical nature of crypto markets means altcoin seasons are recurring phenomena, though their timing and intensity vary based on broader market conditions, regulatory developments, and technological innovation within the blockchain space.
Altcoin Season Index Chart: Key Features
The **Altcoin Season Index** is a quantitative tool that measures whether the cryptocurrency market is in altcoin season or Bitcoin season. The index tracks the performance of the top 50 cryptocurrencies (excluding stablecoins) against Bitcoin over rolling 90-day periods. When 75% or more of these assets outperform Bitcoin, the market enters official altcoin season territory.
This charting tool provides real-time visualization of market dominance shifts between Bitcoin and alternative cryptocurrencies. The index ranges from 0 to 100, with readings above 75 indicating strong altcoin season conditions and readings below 25 suggesting Bitcoin dominance. Mid-range values between 25 and 75 represent mixed market conditions where neither asset class shows clear outperformance.
The methodology behind the index uses percentage-based performance comparisons rather than absolute price changes. This approach accounts for the different market capitalizations and price ranges across cryptocurrencies. The 90-day rolling window filters out short-term noise while capturing meaningful trend shifts, giving investors a clearer picture of sustained market momentum rather than temporary price spikes.
Analyzing the Altcoin Season Index Chart
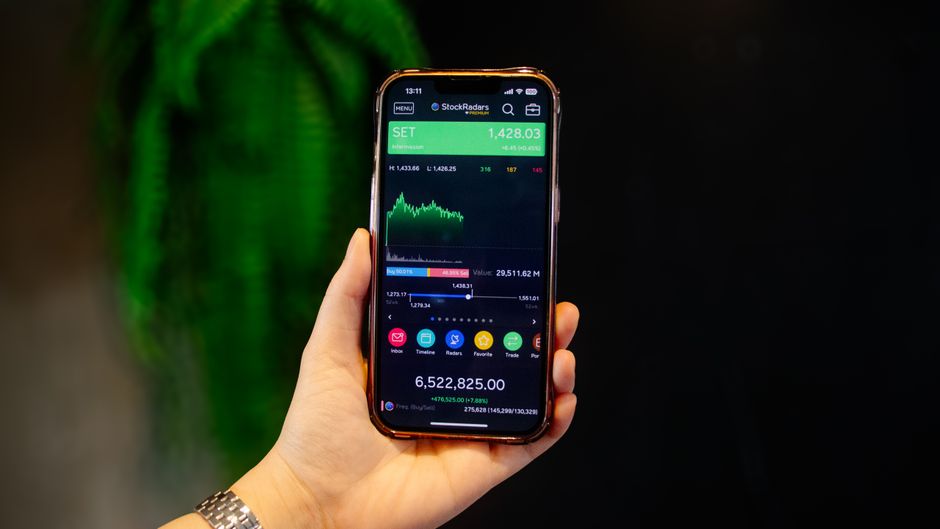
Interpreting the Altcoin Season Index chart requires understanding both the numerical reading and the trend direction. **Index readings above 75** signal that altcoins are broadly outperforming Bitcoin, suggesting strong risk appetite among investors and favorable conditions for altcoin trading. Conversely, readings below 25 indicate Bitcoin is capturing the majority of market gains, typically during risk-off periods or early bull market phases.
The slope and velocity of index changes matter as much as absolute levels. A rapid climb from 40 to 80 over two weeks indicates accelerating altcoin momentum and potentially euphoric market conditions. Gradual increases suggest sustainable growth with lower blow-off risk. Sharp reversals from high readings often precede market corrections as profit-taking intensifies across the altcoin sector.
Seasoned traders combine index analysis with volume data and Bitcoin dominance charts for confirmation. When the index rises while Bitcoin dominance falls and overall market volume increases, the signal becomes more reliable. False signals can occur during low-volume periods or when a handful of large-cap altcoins skew the index without broad market participation. Cross-referencing multiple data sources reduces the risk of misinterpreting temporary fluctuations as sustained trend changes.
Altcoin Market Trends and Patterns
Common patterns during altcoin seasons include **sector rotation**, where capital flows sequentially through different categories like layer-one protocols, DeFi tokens, and meme coins. Early altcoin season phases often see large-cap alternatives like Ethereum gaining first, followed by mid-cap projects, and finally small-cap speculative assets during peak euphoria. This cascade effect reflects increasing risk tolerance as the cycle matures.
Altcoin momentum builds through network effects and social media amplification. As prices rise, media coverage intensifies, attracting retail investors who fear missing out on gains. This self-reinforcing cycle accelerates price appreciation but also increases fragility. Historical data shows altcoin seasons typically last 8-16 weeks before exhaustion sets in and Bitcoin reasserts dominance.
Market corrections during altcoin seasons can be swift and severe. Warning signs include **declining trading volume** despite rising prices, extreme social media sentiment, and clustering of new project launches attempting to capture peak attention. When the index remains above 90 for extended periods, the probability of sharp reversals increases. Pullbacks of 30-50% in altcoin prices within days are common when sentiment shifts, making position sizing and stop-loss discipline critical for capital preservation.
Altcoin Investment Strategies
Diversification across multiple altcoins reduces single-asset risk while maintaining exposure to sector-wide gains. A balanced portfolio might include 40% large-cap alternatives, 35% mid-cap projects with strong fundamentals, and 25% speculative small-caps. This structure captures upside potential while limiting exposure to any single project failure, which is common in the high-risk altcoin space.
Risk management strategies should include **position sizing rules** that limit any single altcoin to 5-10% of total portfolio value. Stop-loss orders help protect against sudden market reversals, though traders must account for crypto’s high volatility when setting levels. Taking partial profits as positions appreciate locks in gains while maintaining upside exposure. A common approach involves selling 25-50% of holdings after 2x gains, then letting remaining positions run with tighter trailing stops.
Successful altcoin strategies balance technical analysis with fundamental research. While the Altcoin Season Index identifies favorable timing, individual coin selection requires evaluating project teams, tokenomics, real-world adoption, and competitive positioning. Dollar-cost averaging into positions during early-stage altcoin seasons can reduce timing risk, while scaling out during late-stage euphoria preserves capital for the next cycle. Maintaining 20-30% cash reserves enables buying opportunities during inevitable corrections.
Altcoin Season and Bitcoin’s Influence
Bitcoin’s performance acts as the primary catalyst for altcoin market cycles. When Bitcoin enters strong uptrends with sustained momentum, it initially absorbs most market capital as investors seek the relative safety of the largest cryptocurrency. Once Bitcoin gains plateau or consolidate at higher levels, profit rotation into altcoins begins, triggering altcoin season dynamics.
The **Bitcoin dominance metric** (Bitcoin’s market cap percentage of total crypto market cap) moves inversely to altcoin season intensity. Dominance declining from 50% to 40% typically coincides with rising Altcoin Season Index readings. This relationship reflects capital redistribution rather than net market inflows. During bearish Bitcoin trends, altcoins generally suffer more severe losses due to their higher beta characteristics and lower liquidity.
Bitcoin price consolidation periods often provide the most favorable conditions for altcoin outperformance. When Bitcoin trades sideways for weeks after significant gains, investor attention shifts to alternatives promising higher returns. However, sharp Bitcoin corrections quickly end altcoin seasons as traders flee to stablecoins or fiat. Monitoring Bitcoin’s 50-day and 200-day moving averages helps anticipate these regime changes, as breakdowns below key support levels typically trigger broad altcoin sell-offs regardless of individual project fundamentals.
Altcoin Season Index Chart: Practical Applications
Investors use the Altcoin Season Index chart as a **market timing filter** for portfolio allocation decisions. When the index crosses above 75 with rising momentum, increasing altcoin exposure from 30% to 60% of crypto holdings can capture upside while maintaining Bitcoin core positions. Conversely, index readings falling below 50 with negative momentum signal time to reduce altcoin exposure and increase Bitcoin or stablecoin allocations.
The chart helps identify false starts versus sustainable altcoin seasons. Brief spikes above 75 that reverse within one week often represent temporary volatility rather than trend changes. Sustained readings above 75 for three consecutive weeks indicate higher probability of extended altcoin outperformance. Combining index readings with on-chain metrics like exchange inflows and active addresses provides confirmation and reduces false signals.
Successful case studies include the 2021 altcoin season when the index remained above 80 for 12 weeks, during which Ethereum gained 150% and mid-cap DeFi tokens appreciated 300-500%. Investors who entered positions when the index crossed 75 and exited as readings peaked above 90 captured substantial gains. The 2022 Bitcoin-dominant market, where the index stayed below 40 for months, demonstrated the value of adapting strategy to market conditions rather than fighting prevailing trends.
Risk Disclaimer
Cryptocurrency markets exhibit extreme volatility with potential for total capital loss. Altcoins carry higher risk than Bitcoin due to lower liquidity, smaller market caps, and greater susceptibility to manipulation. The Altcoin Season Index is an analytical tool, not a guarantee of future performance. Past altcoin seasons do not predict future cycles with certainty.
**This analysis is educational only and does not constitute financial advice.** Readers should conduct independent research and consult licensed financial advisors before making investment decisions. Never invest more than you can afford to lose in cryptocurrency markets. Regulatory changes, technological failures, and market manipulation pose ongoing risks to all digital assets.
Frequently Asked Questions
Q: What is the Altcoin Season Index chart?
A: The Altcoin Season Index chart is a quantitative measurement tool that tracks whether the top 50 cryptocurrencies are outperforming Bitcoin over 90-day rolling periods. When 75% or more of these assets beat Bitcoin’s returns, the market enters altcoin season. The index ranges from 0-100, providing visual representation of capital rotation between Bitcoin and alternative cryptocurrencies.
Q: How can I use the Altcoin Season Index chart to make informed investment decisions?
A: Use the index as a portfolio allocation filter rather than a standalone trading signal. When readings cross above 75 with sustained momentum, consider increasing altcoin exposure while maintaining core Bitcoin positions. Combine index analysis with volume data, Bitcoin dominance charts, and individual project fundamentals. Exit or reduce positions when the index peaks above 90 or shows sharp reversal patterns, as these often precede market corrections.
Q: What are some common market trends and patterns during altcoin seasons?
A: Altcoin seasons typically feature sector rotation where large-cap alternatives gain first, followed by mid-caps, then small-cap speculative assets. Trading volume increases across the market while Bitcoin dominance declines. Social media activity intensifies and new project launches cluster during peak periods. These seasons usually last 8-16 weeks before exhaustion, often ending with rapid 30-50% corrections when sentiment shifts and capital returns to Bitcoin or stablecoins.
Charting & Exchange Resources
| Platform | Use Case | Key Feature | Fee Model | Action |
|---|---|---|---|---|
| TradingView | Charting & technical analysis | Indicators, multi-timeframe charts | Free / Pro tiers | View Platform |
| Coinbase | Exchange (beginner-friendly) | Simple USD on-ramp, educational tools | Varies by region | View Platform |
| Binance | Exchange (advanced pairs) | Wide altcoin coverage, spot markets | Varies by region | View Platform |
Affiliate Disclosure: This post contains affiliate links. We may earn a commission if you buy through our links, at no extra cost to you. Investment Risk Disclaimer: Cryptocurrency and digital asset markets are highly volatile. This content is for informational and educational purposes only and is not financial, investment, or trading advice. You may lose some or all of your capital. Do your own research and consult a licensed financial advisor before making investment decisions.
Leave a Reply