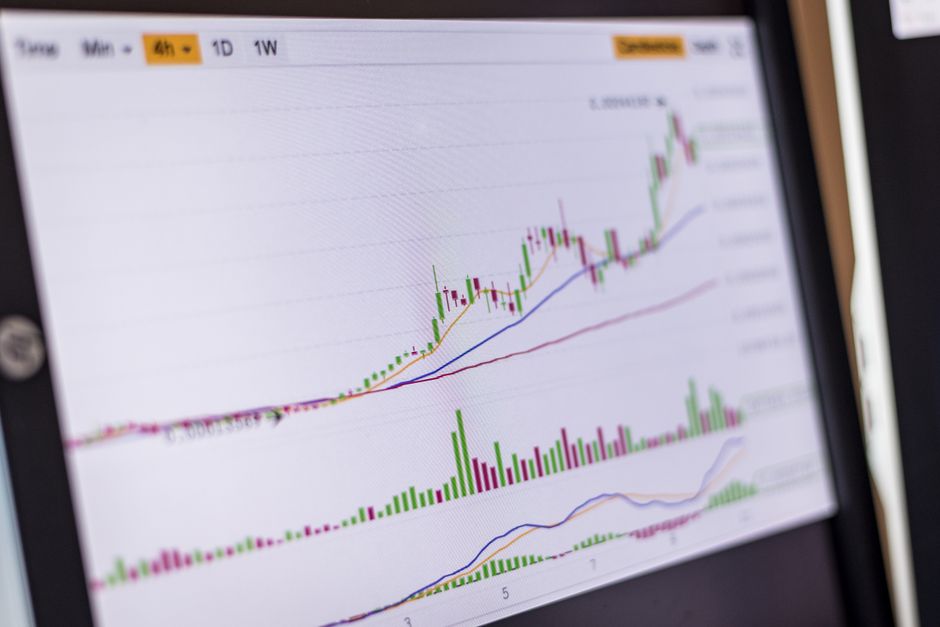
Altcoin Season Explained
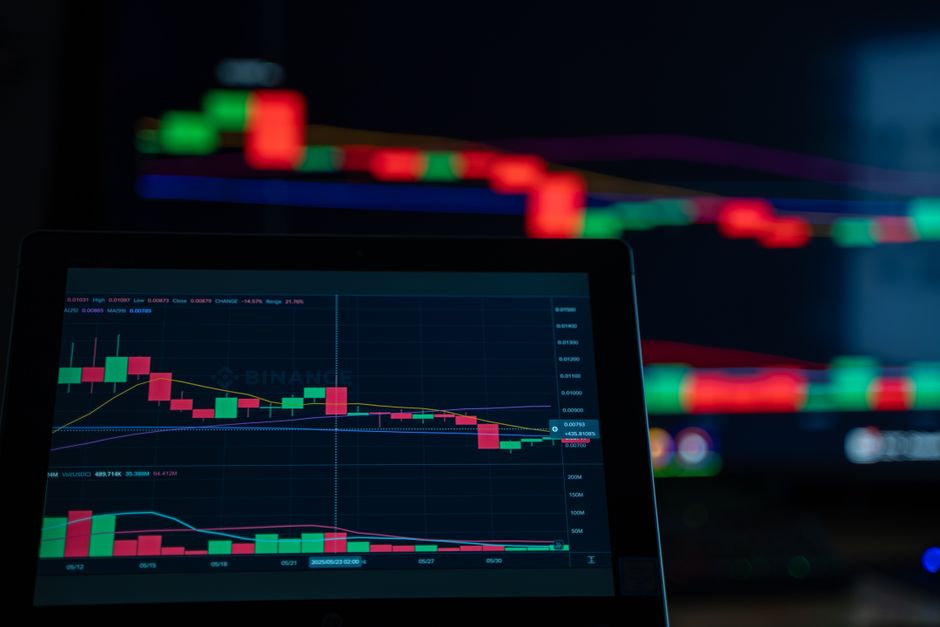
The cryptocurrency market moves in cycles, and understanding these patterns helps investors make informed decisions. **Altcoin season** refers to periods when alternative cryptocurrencies significantly outperform Bitcoin, the market’s dominant digital asset. During these windows, traders often see substantial gains across mid-cap and small-cap tokens.
The **Altcoin Season Index (ASI)** provides a quantitative framework for identifying these periods. This metric tracks the performance of the top 50 cryptocurrencies (excluding stablecoins) against Bitcoin over rolling 90-day windows. When 75% or more of these assets outperform Bitcoin, the market enters official altcoin season territory.
Understanding the ASI matters because it signals capital rotation within crypto markets. When Bitcoin dominance weakens and investor confidence spreads to alternative projects, entirely different trading strategies become relevant. The index removes guesswork from market sentiment analysis by providing objective, data-driven signals.
Altcoin Market Trends and Analysis
The altcoin market in 2025 shows distinct characteristics shaped by regulatory clarity, institutional adoption patterns, and technological maturity. Layer-2 scaling solutions, decentralized finance protocols, and real-world asset tokenization projects have attracted significant capital flows. Market capitalization across altcoins has expanded beyond meme-driven speculation into utility-focused ecosystems.
Several factors drive altcoin price movements and overall market health. **Regulatory developments** in the United States, particularly SEC classification decisions and potential spot ETF approvals for major altcoins, create volatility spikes. Bitcoin halving cycles historically precede altcoin rallies as capital seeks higher-risk, higher-reward opportunities after Bitcoin stabilizes post-halving.
Macroeconomic conditions heavily influence altcoin performance. Interest rate policies from the Federal Reserve affect risk appetite across all speculative assets. When traditional markets enter risk-on environments, altcoins typically see accelerated inflows. Conversely, flight-to-quality periods drive capital back to Bitcoin or fiat positions. Recent analysis shows altcoins correlate strongly with tech stock indices, particularly the Nasdaq, suggesting institutional money treats them as growth-oriented digital assets.
Altcoin Season Index Chart
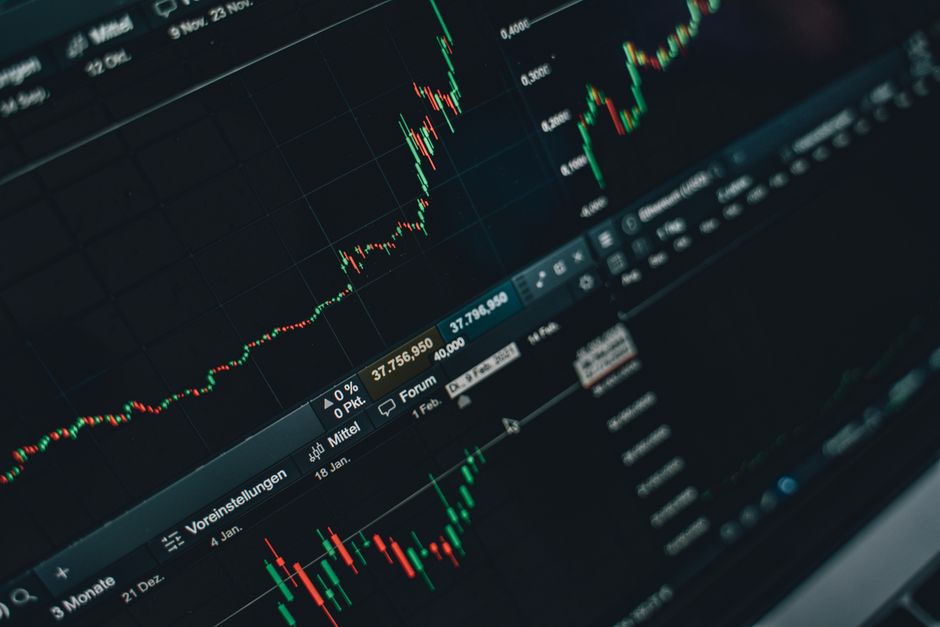
An **ASI chart** visualizes the percentage of top altcoins outperforming Bitcoin over time. The y-axis typically ranges from 0% to 100%, representing the proportion of tracked assets beating Bitcoin’s returns. The x-axis displays time intervals, usually daily or weekly data points. A horizontal line at 75% marks the threshold where markets officially enter altcoin season.
Reading an ASI chart requires attention to trend direction and threshold crossings. When the line rises above 75%, it signals widespread altcoin strength and potential opportunities across diverse projects. Sustained readings above 90% indicate extreme altcoin dominance, which historically precedes market corrections. Conversely, readings below 25% suggest Bitcoin is capturing most market gains, and altcoin positions carry elevated risk.
Key metrics embedded in ASI charts include:
- **90-day rolling performance comparison** between each top-50 altcoin and Bitcoin
- **Percentage threshold indicators** at 25%, 50%, and 75% levels
- **Historical average lines** showing typical market conditions
- **Volume-weighted adjustments** in some advanced implementations
Traders use chart patterns to time entries and exits. A rising ASI from below 50% toward 75% often presents accumulation opportunities before mainstream attention arrives. Divergences between ASI trends and overall market cap growth can signal underlying weakness despite surface-level strength.
Altcoin Season Index vs Bitcoin Dominance
Bitcoin dominance measures Bitcoin’s market cap as a percentage of total cryptocurrency market cap. While both metrics track market leadership, they measure fundamentally different dynamics. **Bitcoin dominance** is a zero-sum game—when it rises, altcoins collectively lose market share. The ASI focuses specifically on price performance relative to Bitcoin, not absolute market cap distribution.
Bitcoin dominance can increase even during bull markets if Bitcoin outpaces altcoin gains. The ASI specifically identifies when altcoins deliver superior returns, regardless of whether total crypto market cap is rising or falling. During bear markets, Bitcoin dominance typically climbs as investors flee to relative safety, while the ASI drops below 25%.
Neither metric is definitively more accurate for predictions—they serve complementary purposes. Bitcoin dominance helps identify capital rotation at the macro level and signals market cycle phases. The ASI provides actionable timing signals for traders deciding between Bitcoin and altcoin allocations. Combined analysis offers the most complete picture: declining Bitcoin dominance with rising ASI strongly suggests altcoin season momentum.
Historical data shows ASI tends to lag Bitcoin dominance shifts by 2-4 weeks. When Bitcoin dominance peaks and begins declining, the ASI often remains neutral before accelerating upward. This lag creates a window where informed traders can position ahead of broader market recognition.
Altcoin Investment Strategies
Diversification across cryptocurrency sectors reduces portfolio volatility while maintaining upside exposure. Rather than concentrating in a single altcoin, spreading capital across **infrastructure projects** (layer-1 and layer-2 protocols), **DeFi platforms**, **gaming and metaverse tokens**, and **real-world asset tokenization** captures varied growth narratives. Allocate larger portions to established mid-cap projects with proven development teams and smaller experimental positions in emerging categories.
Timing entries based on ASI readings requires discipline and clear rules. When the ASI crosses above 75%, consider scaling into altcoin positions gradually rather than deploying full capital immediately. Historical patterns show altcoin seasons last 60-120 days on average. Exit signals include ASI declining below 65% after extended periods above 75%, or Bitcoin dominance bottoming and beginning sustained uptrends.
Risk management for altcoin investing demands strict position sizing and stop-loss discipline:
- **Limit individual altcoin positions** to 2-5% of total crypto portfolio
- **Set stop-losses** at 15-25% below entry prices to prevent catastrophic losses
- **Rebalance quarterly** to capture gains from outperformers and trim overweight positions
- **Maintain 20-30% in stablecoins** or Bitcoin for liquidity during market dislocations
Volatility in altcoins significantly exceeds Bitcoin—50-70% drawdowns occur regularly even in bull markets. Never invest capital needed for living expenses or near-term financial obligations. Dollar-cost averaging into positions over 4-8 weeks reduces timing risk compared to lump-sum entries.
Altcoin Season Index Predictions and Forecasts
Predicting the next altcoin season involves analyzing multiple converging factors rather than relying on the ASI alone. Historical patterns suggest altcoin seasons typically occur 6-12 months after Bitcoin halving events, once Bitcoin establishes new price stability. The most recent halving in April 2024 positions mid-to-late 2025 as a potential altcoin season window based purely on cycle theory.
Several technical and fundamental factors could drive ASI values higher in coming months. **Ethereum spot ETF adoption** expanding beyond initial launches would channel institutional capital directly into the altcoin ecosystem. Layer-2 scaling solutions reaching mainstream transaction volumes would demonstrate real utility beyond speculation. Regulatory clarity from the SEC reclassifying major tokens away from securities designation would remove significant overhang.
Macroeconomic conditions present the largest variable. Federal Reserve pivot toward rate cuts would likely trigger risk-on behavior across speculative assets, benefiting altcoins disproportionately. Conversely, renewed inflation concerns keeping rates elevated longer could extend Bitcoin-dominated market conditions. Analyst consensus suggests 40-60% probability of meaningful altcoin season materializing before Q4 2025.
**Important risk context:** These observations reflect historical patterns and current market structure, not guaranteed outcomes. Cryptocurrency markets remain highly speculative and unpredictable. Past altcoin seasons do not ensure future repetition of similar dynamics. Market conditions can change rapidly based on regulatory actions, security breaches, or macroeconomic shocks.
Altcoin Season Index Tools and Resources
Major cryptocurrency exchanges provide varying levels of ASI tracking and altcoin market analytics. **Coinbase** and **Kraken** offer institutional-grade charting with customizable technical indicators, though neither provides native ASI overlays. **Binance** features the most comprehensive altcoin selection with real-time performance comparisons, allowing manual ASI calculation through market screeners.
Dedicated ASI charting platforms include blockchaincenter.net, which maintains the most widely referenced public ASI chart updated daily. The platform tracks the top 50 altcoins by market cap against Bitcoin performance over 90-day rolling windows. Users can view historical ASI data back to 2017, identifying previous altcoin seasons and typical duration patterns.
Additional analytical resources for tracking altcoin market trends:
- **TradingView** for custom indicator development and community-shared ASI scripts
- **Glassnode** for on-chain metrics showing capital flows between Bitcoin and altcoins
- **Messari** for fundamental research and tokenomics analysis of major altcoin projects
- **CoinGecko** and **CoinMarketCap** for market cap rankings and sector performance comparisons
Professional traders often combine ASI data with Bitcoin dominance charts, exchange funding rates, and social sentiment analysis for comprehensive market reads. Setting alerts when ASI crosses key thresholds (50%, 75%, 90%) helps capture early-stage trends before broader market recognition.
Risk Disclaimer
Cryptocurrency investing carries substantial financial risk and may not be suitable for all investors. Altcoins exhibit extreme price volatility, with potential for total loss of invested capital. The Altcoin Season Index and related metrics are analytical tools, not financial advice or guaranteed predictive indicators.
Past performance of altcoins during previous market cycles does not guarantee similar future results. Regulatory changes, technological failures, security breaches, and macroeconomic shifts can rapidly alter market dynamics. **Always conduct thorough due diligence** on individual projects, understand the technology and team behind any investment, and never invest more than you can afford to lose completely.
This article provides educational information about market analysis tools and does not constitute personalized investment advice. Consult qualified financial advisors familiar with cryptocurrency risks before making investment decisions. Tax treatment of cryptocurrency varies by jurisdiction—understand your local reporting obligations before trading.
Frequently Asked Questions
What does the Altcoin Season Index measure?
A: The Altcoin Season Index measures what percentage of the top 50 cryptocurrencies (by market cap, excluding stablecoins) have outperformed Bitcoin over the previous 90 days. When this percentage exceeds 75%, markets are considered to be in altcoin season, indicating widespread strength across alternative cryptocurrencies relative to Bitcoin’s performance.
How often is the ASI updated?
A: The Altcoin Season Index updates daily on most public tracking platforms, incorporating the latest 24-hour price performance data. Some professional-grade tools offer hourly or real-time updates. The 90-day calculation window rolls forward continuously, meaning each new day drops the oldest day from the measurement period and adds the most recent data.
Can the ASI predict the next altcoin season?
A: The ASI cannot predict future altcoin seasons—it measures current and historical market conditions rather than forecasting. However, analyzing ASI trends alongside Bitcoin dominance, on-chain metrics, and macroeconomic factors helps investors identify early-stage shifts in market dynamics. Rising ASI from low levels often signals emerging altcoin strength before reaching the 75% threshold that defines official altcoin season.
Charting & Exchange Resources
| Platform | Use Case | Key Feature | Fee Model | Action |
|---|---|---|---|---|
| TradingView | Charting & technical analysis | Indicators, multi-timeframe charts | Free / Pro tiers | View Platform |
| Coinbase | Exchange (beginner-friendly) | Simple USD on-ramp, educational tools | Varies by region | View Platform |
| Binance | Exchange (advanced pairs) | Wide altcoin coverage, spot markets | Varies by region | View Platform |
Affiliate Disclosure: This post contains affiliate links. We may earn a commission if you buy through our links, at no extra cost to you. Investment Risk Disclaimer: Cryptocurrency and digital asset markets are highly volatile. This content is for informational and educational purposes only and is not financial, investment, or trading advice. You may lose some or all of your capital. Do your own research and consult a licensed financial advisor before making investment decisions.
Leave a Reply