Understanding Altcoin Season

Altcoin season refers to periods in the cryptocurrency market where altcoins, or alternative cryptocurrencies, experience significant price increases relative to Bitcoin. These seasons often follow a surge in Bitcoin’s price, as investors seek to diversify their portfolios and capture gains in smaller, more volatile coins. The Altcoin Season Index (ASI) chart is a tool designed to track and predict these market cycles, helping investors make informed decisions.
Key Altcoin Season Index Chart Metrics
The ASI chart uses several key metrics to measure market performance and predict altcoin season. These include:
- **Market Capitalization Ratio**: This metric compares the total market capitalization of altcoins to that of Bitcoin, providing insight into the relative dominance of altcoins in the market.
- **Trading Volume**: The ASI chart tracks the trading volume of altcoins compared to Bitcoin, as increased volume can indicate growing investor interest and potential price movements.
- **Price Momentum**: By analyzing the price momentum of various altcoins, the ASI chart helps identify coins that are gaining or losing traction in the market.
Analyzing the Altcoin Season Index Chart
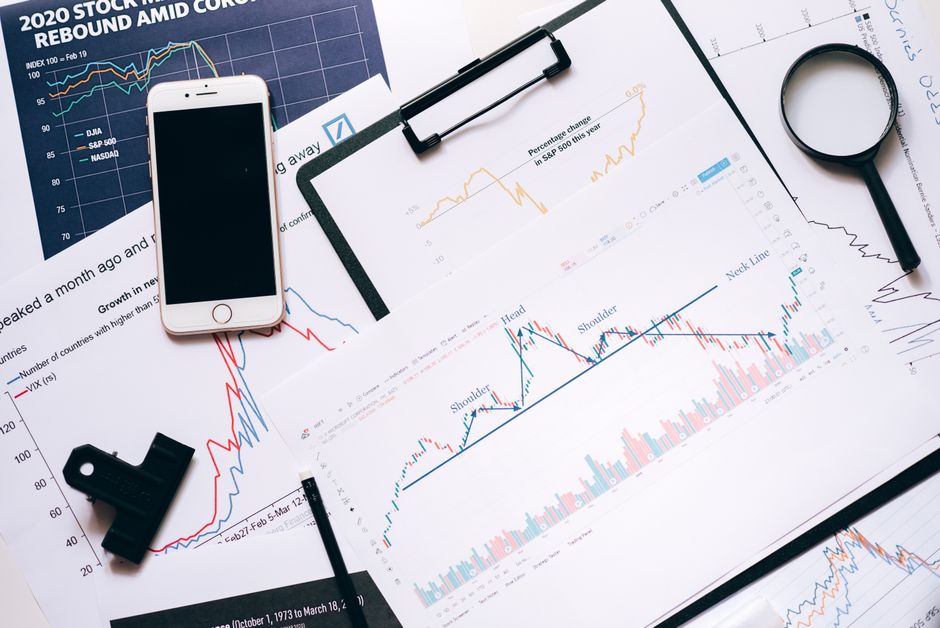
To accurately interpret the ASI chart, investors should consider the following factors:
- **Trend Direction**: A rising ASI chart indicates a strong altcoin market, while a falling chart suggests a weakening altcoin season.
- **Support and Resistance Levels**: Identifying key support and resistance levels on the ASI chart can help investors spot potential entry and exit points for their trades.
- **Divergences**: Divergences between the ASI chart and individual altcoin prices can signal potential reversals or continuations of market trends.
Risks and Challenges in Altcoin Season Investing
Investing in altcoins during altcoin season comes with inherent risks and challenges. These include:
- **Market Volatility**: Altcoins are known for their high volatility, which can lead to significant price swings and potential losses for investors.
- **Misinterpretation of Data**: Accurately interpreting the ASI chart and other market data requires skill and experience, and misinterpretation can lead to poor investment decisions.
- **Market Manipulation**: The cryptocurrency market is susceptible to manipulation by large investors or groups, which can distort the accuracy of the ASI chart and other market indicators.
Practical Applications of the Altcoin Season Index Chart
Investors can use the ASI chart to identify profitable investment opportunities and manage risk. Some practical applications include:
- **Diversification**: By tracking the performance of various altcoins, investors can diversify their portfolios and reduce their overall risk exposure.
- **Market Timing**: The ASI chart can help investors identify optimal entry and exit points for their trades, maximizing their potential returns.
- **Risk Management**: By monitoring the ASI chart and other market indicators, investors can set stop-loss orders and other risk management strategies to protect their investments.
Frequently Asked Questions (FAQ)
What is the significance of the Altcoin Season Index chart in cryptocurrency markets?
The Altcoin Season Index chart plays a crucial role in helping investors understand and track market cycles. By analyzing key metrics such as market capitalization ratio, trading volume, and price momentum, the ASI chart provides valuable insights into the performance of altcoins relative to Bitcoin. This information can be used by investors to make informed decisions, diversify their portfolios, and manage risk.
How can investors use the Altcoin Season Index chart to make informed investment decisions?
Investors can use the ASI chart to identify potential investment opportunities and manage risk. By analyzing trend direction, support and resistance levels, and divergences, investors can make more accurate predictions about the future performance of altcoins. Additionally, by monitoring the ASI chart alongside other market indicators, investors can set stop-loss orders and other risk management strategies to protect their investments.
What are the risks associated with investing in altcoins during altcoin season?
Investing in altcoins during altcoin season comes with several risks, including market volatility, misinterpretation of data, and market manipulation. To mitigate these risks, investors should conduct thorough research, diversify their portfolios, and use risk management strategies such as stop-loss orders. Additionally, investors should be aware of the potential for market manipulation and exercise caution when interpreting market data.
Charting & Exchange Resources
| Platform | Use Case | Key Feature | Fee Model | Action |
|---|---|---|---|---|
| TradingView | Charting & technical analysis | Indicators, multi-timeframe charts | Free / Pro tiers | View Platform |
| Coinbase | Exchange (beginner-friendly) | Simple USD on-ramp, educational tools | Varies by region | View Platform |
| Binance | Exchange (advanced pairs) | Wide altcoin coverage, spot markets | Varies by region | View Platform |
Affiliate Disclosure: This post contains affiliate links. We may earn a commission if you buy through our links, at no extra cost to you. Investment Risk Disclaimer: Cryptocurrency and digital asset markets are highly volatile. This content is for informational and educational purposes only and is not financial, investment, or trading advice. You may lose some or all of your capital. Do your own research and consult a licensed financial advisor before making investment decisions.
Leave a Reply