
What Is Altcoin Season — and Why Does It Matter?
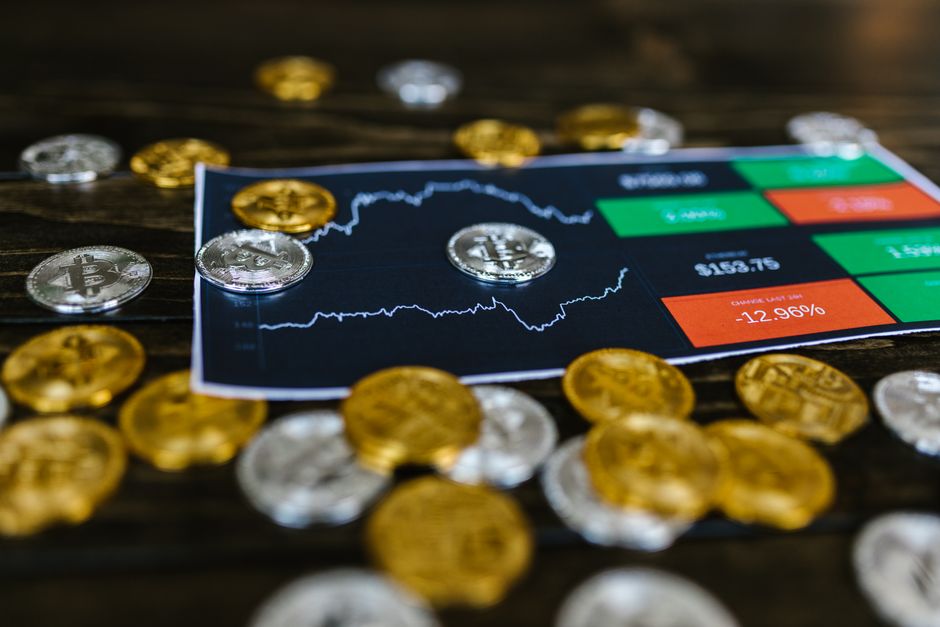
If you’ve spent any time in crypto markets, you’ve probably heard the term **altcoin season** thrown around during bull runs. But understanding what it actually means — and how to measure it — is where most retail investors fall short. The **altcoin season index chart** is the closest thing the crypto market has to a reliable compass for navigating these cycles.
An **altcoin** (alternative coin) is any cryptocurrency that isn’t Bitcoin (BTC). That umbrella covers everything from Ethereum (ETH) and Solana (SOL) to hundreds of smaller-cap tokens. During certain market phases, these assets collectively outperform Bitcoin — sometimes by dramatic margins. That window is what traders call **altcoin season**.
Understanding this cycle matters because it changes the risk profile of every position you hold. Capital rotation — when investors move funds out of Bitcoin and into altcoins chasing higher percentage gains — drives these periods. Recognizing that rotation early gives investors context, not a crystal ball, but context is valuable in a market this volatile.
—
The Altcoin Season Index Chart Explained
The **Altcoin Season Index (ASI)** was popularized by blockchain data platforms and is now widely referenced by analysts across the industry. At its core, the ASI measures how many of the top 50 altcoins (by market capitalization, excluding stablecoins and wrapped tokens) have outperformed Bitcoin over the past 90 days.
- If **75% or more** of those 50 coins beat BTC over 90 days → the index flags **Altcoin Season**
- If **25% or fewer** beat BTC → the index flags **Bitcoin Season**
- Everything in between is considered a **neutral or transitional phase**
The index produces a score from **1 to 100**. Scores above 75 indicate altcoin dominance; scores below 25 indicate Bitcoin dominance. The 90-day lookback window smooths out short-term noise while still being responsive enough to catch meaningful trend shifts.
The chart is typically updated daily, so traders can monitor incremental moves rather than waiting for lagging weekly or monthly signals. Most major crypto data aggregators publish this chart for free.
—
Key Components Driving the ASI Chart
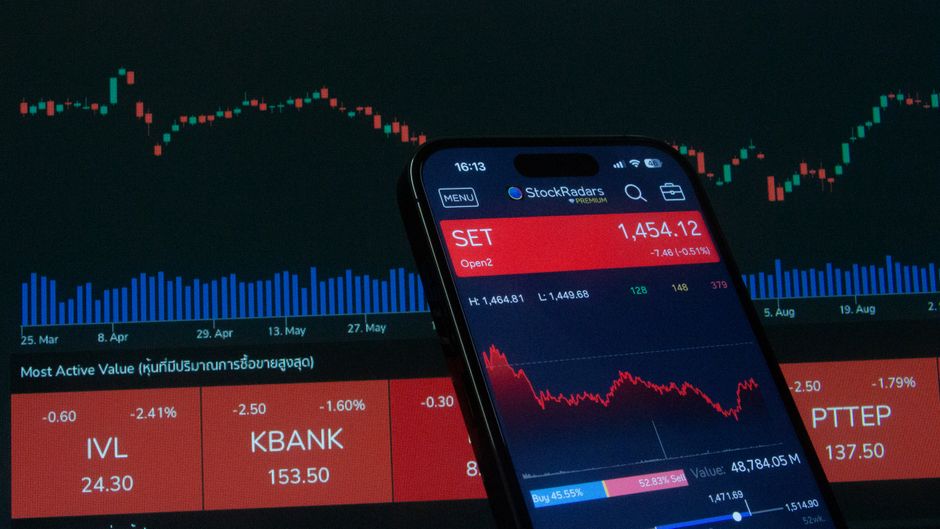
The ASI doesn’t operate in a vacuum. Three underlying data streams feed into the signals the chart produces, and understanding each one helps you interpret the index with more precision.
Market Capitalization of Altcoins
**Market capitalization** (market cap) is the total value of all circulating coins for a given asset, calculated as price × circulating supply. When altcoin market caps collectively expand faster than Bitcoin’s, capital rotation is happening in real time. The ASI chart essentially tracks whether that rotation is broad-based or isolated to one or two large-cap outliers.
Trading Volume
**Trading volume** measures how much of an asset changes hands in a given period. A rising ASI score accompanied by surging altcoin trading volume is a stronger signal than a score rise on thin volume. Low-volume moves are easier to reverse and may represent manipulation in smaller-cap markets rather than genuine institutional or retail demand.
Price Trends of Top Altcoins
The composition of the top 50 altcoins shifts over time as new projects rise and others fade. The ASI captures **price trend breadth** — meaning it rewards wide participation across many coins rather than one headline asset skewing the entire index. A broad rally where 40 of 50 coins outperform BTC is structurally different (and arguably more sustainable) than a rally where only 5 mega-caps drag the number higher.
—
How to Read and Interpret the ASI Chart
Reading the ASI chart effectively means looking at more than just today’s score. Trend direction, velocity, and confluence with other on-chain and macro signals all add context that a single data point can’t provide.
**Key interpretation principles:**
- **Rising score from below 50 toward 75+** — early rotation signal; historically precedes broader altcoin rallies
- **Score sustained above 75 for multiple weeks** — confirms an active altcoin season, not a one-week anomaly
- **Sharp drop from 80+ back below 50 within days** — often signals a risk-off event or Bitcoin dominance reclaim
- **Flat score in the 40–60 range** — indeterminate market; Bitcoin and altcoins are roughly co-moving
Confluence Signals Worth Watching
No single indicator should drive investment decisions, but the ASI becomes more useful when combined with:
- **Bitcoin Dominance (BTC.D)** — BTC dominance falling while ASI rises confirms rotation is happening
- **Total crypto market cap (TOTAL2)** — tracks the combined market cap of all crypto excluding Bitcoin; rising TOTAL2 alongside ASI confirms money is entering altcoins
- **Fear & Greed Index** — extreme greed readings combined with high ASI scores have historically marked cycle peaks
A professional crypto analyst will typically require at least 2–3 of these signals aligning before drawing strong conclusions about market positioning.
—
Comparison: Altcoin Season vs. Bitcoin Season
| Metric | Altcoin Season | Bitcoin Season |
|---|---|---|
| ASI Score | 75–100 | 1–25 |
| BTC Dominance | Declining | Rising |
| TOTAL2 Chart | Rising | Flat or Declining |
| Typical Investor Mood | Risk-on | Risk-off or BTC accumulation |
| Small-cap Volatility | Very High | Moderate to High |
| Historical Duration | Weeks to months | Varies widely |
This table reflects general historical patterns. No two market cycles are identical, and past performance does not indicate future results.
—
Risks and Rewards of Altcoin Market Exposure
Altcoins can deliver percentage gains that Bitcoin — given its larger market cap — rarely replicates in a single cycle. That asymmetry attracts capital. But the same asymmetry works in reverse: altcoins also suffer deeper drawdowns, faster liquidity crunches, and more frequent total-loss scenarios than Bitcoin.
**Core risks to understand before using the ASI as a trading signal:**
- **Liquidity risk** — Many altcoins outside the top 20 have shallow order books. A large sell order can move the price significantly against you.
- **Project risk** — Unlike Bitcoin, altcoin projects carry execution, team, and regulatory risk that can send a coin to near zero regardless of market conditions.
- **Correlation collapse** — During macro risk-off events (rate hikes, exchange collapses, regulatory actions), altcoins often crash harder and faster than Bitcoin, erasing altcoin season gains rapidly.
- **Index timing lag** — The ASI uses a 90-day lookback. By the time the index clearly reads “Altcoin Season,” a significant portion of the move may already have occurred.
The potential reward is real, but it comes packaged with complexity that requires diligent research and a clear risk management plan.
—
Practical Tips for Using the ASI in Your Strategy
Using the ASI as part of a broader analytical framework — not as a standalone buy/sell trigger — is the approach most professional traders take. Here’s how to incorporate it practically.
Build a Monitoring Routine
- Check the ASI score daily during active market conditions
- Track the 7-day and 30-day trend of the score, not just today’s number
- Set threshold alerts (e.g., score crossing 75 or dropping below 50)
Apply Portfolio Diversification Principles
Crypto portfolio construction during altcoin season typically involves **tiering** by risk level:
- **Tier 1** — Large-cap altcoins (ETH, SOL, etc.): lower volatility within the altcoin space
- **Tier 2** — Mid-cap altcoins: higher upside potential, higher risk
- **Tier 3** — Small-cap tokens: speculative positions only, sized accordingly
Allocation to each tier should reflect your personal risk tolerance. A common approach is to hold a larger percentage in Tier 1 and use smaller position sizes as you move down the risk curve.
Avoid Common ASI Misreads
- Don’t treat a single day’s spike in ASI as confirmation of a new altcoin season
- Don’t ignore macro context — a Federal Reserve rate decision or major regulatory announcement can override any technical signal
- Don’t use ASI to time exact entry or exit points; use it to assess the **character** of the current market environment
—
What the ASI Can’t Tell You
The ASI is a rear-looking, aggregate indicator. It tells you what has happened over the past 90 days across a basket of 50 assets. It cannot tell you which specific altcoin will outperform, when exactly the season will end, or how severe the subsequent correction will be.
For US investors specifically, there’s also a **regulatory layer** worth acknowledging. The Securities and Exchange Commission (SEC) has ongoing enforcement actions and rulemaking efforts that affect which altcoins can be legally traded on US-regulated platforms. An altcoin flagged as an unregistered security can be delisted from major US exchanges abruptly, creating liquidity events that no index chart would have predicted.
Always verify that any altcoin you’re researching is available on a compliant, regulated US platform before factoring it into your strategy.
—
Risk Disclaimer
**Cryptocurrency markets are highly volatile.** Altcoins, in particular, carry significant risk of rapid and substantial loss of value. The **Altcoin Season Index** is an educational and analytical tool — it does not predict future performance and should not be interpreted as a signal to buy or sell any asset. This article is for **informational and educational purposes only** and does not constitute financial, investment, tax, or legal advice. Always conduct your own independent research and consult with a qualified financial advisor before making any investment decisions.
—
Frequently Asked Questions (FAQ)
Q: What is the difference between Altcoin Season and Bitcoin Season?
A: Altcoin Season occurs when the majority of the top 50 altcoins outperform Bitcoin over a 90-day period, reflected by an ASI score above 75. Bitcoin Season is the inverse — fewer than 25% of those altcoins beat BTC, with BTC Dominance typically rising as investors consolidate into the market’s largest and most liquid asset.
Q: How often is the Altcoin Season Index chart updated?
A: Most platforms that publish the ASI update it daily, giving traders a fresh score each day based on the rolling 90-day performance window. While the index reacts incrementally rather than dramatically day-to-day, monitoring it daily during active markets helps you spot trend shifts before they become obvious.
Q: Can analyzing the ASI chart guarantee profitable investments in altcoins?
A: No. The ASI is a descriptive, backward-looking indicator — it reflects what has already happened across a basket of assets. No chart, index, or analytical tool can guarantee profitable outcomes in cryptocurrency markets. The ASI is best used as one input among several within a disciplined, research-based investment framework, not as a standalone decision-making signal.
Charting & Exchange Resources
| Platform | Use Case | Key Feature | Fee Model | Action |
|---|---|---|---|---|
| TradingView | Charting & technical analysis | Indicators, multi-timeframe charts | Free / Pro tiers | View Platform |
| Coinbase | Exchange (beginner-friendly) | Simple USD on-ramp, educational tools | Varies by region | View Platform |
| Binance | Exchange (advanced pairs) | Wide altcoin coverage, spot markets | Varies by region | View Platform |
Affiliate Disclosure: This post contains affiliate links. We may earn a commission if you buy through our links, at no extra cost to you. Investment Risk Disclaimer: Cryptocurrency and digital asset markets are highly volatile. This content is for informational and educational purposes only and is not financial, investment, or trading advice. You may lose some or all of your capital. Do your own research and consult a licensed financial advisor before making investment decisions.
Leave a Reply