Understanding Crypto Market Charts

Reading and understanding crypto market charts is essential for any beginner looking to enter the world of cryptocurrency trading. Market charts provide valuable insights into price movements, trading volume, and market sentiment. They help traders make informed decisions based on historical data and current trends.
There are several types of charts used in crypto market analysis, including line charts, bar charts, and candlestick charts. Each type offers a different perspective on market data. Candlestick charts are the most popular among crypto traders due to their ability to display open, close, high, and low prices for a given time period.
Time frames are another important aspect of analyzing market charts. Traders can choose from various time frames, such as 1-minute, 5-minute, 15-minute, 1-hour, 4-hour, daily, weekly, and monthly. The choice of time frame depends on the trader’s strategy and the cryptocurrency being analyzed.
Key Metrics on Crypto Market Charts
When analyzing crypto market charts, there are several key metrics that traders should focus on:
- **Price and volume data:** The price of a cryptocurrency and its trading volume are the most fundamental metrics to consider. Price indicates the current value of the cryptocurrency, while volume represents the number of tokens being traded.
- **Trading pairs and exchanges:** Cryptocurrencies are traded in pairs (e.g., BTC/USD, ETH/BTC) on various exchanges. Understanding the trading pairs and the exchanges they are traded on can help traders make better decisions.
- **Market capitalization and circulating supply:** Market capitalization is the total value of a cryptocurrency, calculated by multiplying the current price by the circulating supply. Circulating supply refers to the number of tokens currently available for trading.
Reading a Candlestick Chart
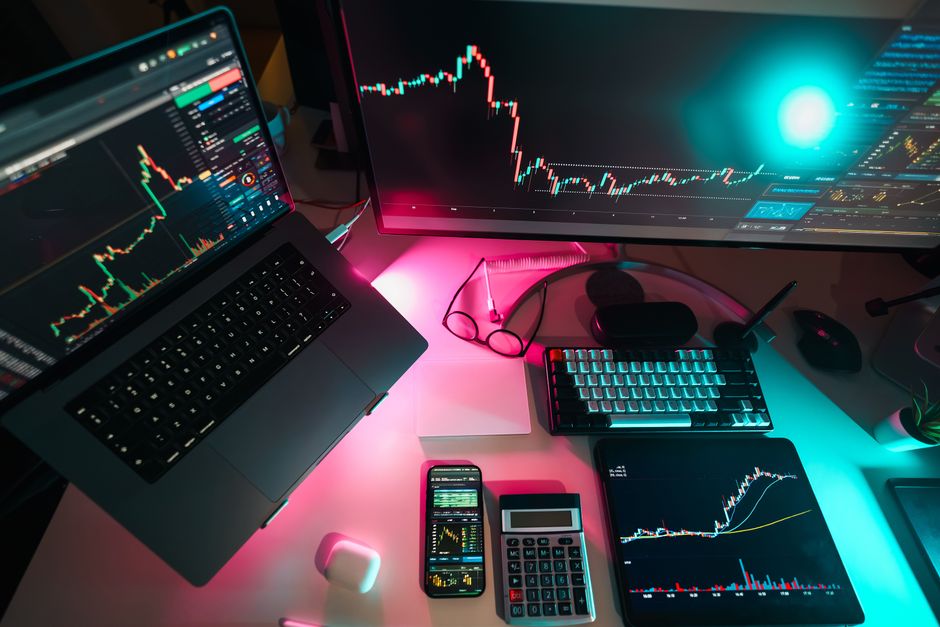
Candlestick charts are the most widely used type of chart in crypto market analysis. Each candlestick represents a specific time period and displays the open, close, high, and low prices for that period.
The body of the candlestick represents the open and close prices, while the wicks (or shadows) represent the high and low prices. If the close price is higher than the open price, the candlestick is typically green or white. If the close price is lower than the open price, the candlestick is typically red or black.
Patterns and trends can be identified by analyzing the size, color, and position of candlesticks. For example, a long green candlestick followed by a short red candlestick may indicate a potential trend reversal.
Using Technical Indicators
Technical indicators are mathematical tools used to analyze market data and generate buy or sell signals. Some of the most popular technical indicators in crypto trading include:
- **Moving averages (MA):** Moving averages help smooth out price fluctuations and identify trends. The two most common types of moving averages are the Simple Moving Average (SMA) and the Exponential Moving Average (EMA).
- **Relative Strength Index (RSI):** RSI is a momentum oscillator that measures the speed and change of price movements. It ranges from 0 to 100 and is used to identify overbought or oversold conditions.
- **Bollinger Bands:** Bollinger Bands consist of a moving average and two standard deviation bands. They help measure market volatility and identify potential breakouts or reversals.
Analyzing Trading Volume and Trends
Trading volume is an essential metric in crypto market analysis. It represents the number of tokens being traded over a specific period and can help confirm price trends and patterns.
An increase in trading volume often accompanies a significant price movement. Conversely, a decrease in volume may indicate a lack of interest or a potential trend reversal.
Analyzing volume changes over time can help traders identify market trends and make better trading decisions. For example, a sudden spike in volume accompanied by a price increase may indicate a bullish trend.
Risk Management in Crypto Trading
Cryptocurrencies are known for their high volatility, which can lead to significant gains or losses in a short period. Effective risk management is crucial for long-term success in crypto trading.
Some risk management strategies include:
- **Diversifying your cryptocurrency portfolio:** By investing in multiple cryptocurrencies, traders can reduce the impact of a single poor-performing asset on their overall portfolio.
- **Setting stop-loss orders:** Stop-loss orders automatically sell a cryptocurrency when its price reaches a predetermined level. This helps limit potential losses in case of a market downturn.
- **Taking profits:** Traders should have a plan for taking profits at predetermined levels to lock in gains and reduce the risk of giving back profits during market fluctuations.
Practical Tips for Beginners
For beginners looking to start analyzing crypto market charts, here are some practical tips:
- **Choose the right cryptocurrency exchange:** Select an exchange that offers a wide range of cryptocurrencies, low fees, and a user-friendly interface.
- **Set up a charting platform:** Many cryptocurrency exchanges offer built-in charting tools, but third-party platforms like TradingView provide more advanced features and customization options.
- **Develop a trading plan:** Based on your market analysis, create a trading plan that outlines your entry and exit strategies, risk management rules, and profit targets.
Frequently Asked Questions (FAQ)
What are the most reliable sources for cryptocurrency market data?
Some of the most reliable sources for cryptocurrency market data include CoinMarketCap, CoinGecko, and CryptoCompare. These platforms aggregate data from various exchanges and provide up-to-date information on prices, volumes, and market capitalizations.
How often should I consult market charts for my trading decisions?
The frequency of consulting market charts depends on your trading strategy and the time frame you are analyzing. Day traders may need to consult charts every few minutes, while longer-term investors may only need to check charts once a day or less.
Is it necessary to understand complex technical indicators for successful crypto trading?
While understanding complex technical indicators can be beneficial, it is not necessary for successful crypto trading. Many traders rely on simple indicators like moving averages and RSI or focus on price action and volume analysis. The key is to find a strategy that works best for you and stick to it.
How can I avoid common mistakes when analyzing crypto market charts?
Some common mistakes to avoid when analyzing crypto market charts include:
- **Overtrading:** Avoid making too many trades based on small price movements or short-term patterns.
- **Ignoring risk management:** Always use stop-loss orders and diversify your portfolio to manage risk effectively.
- **Relying on a single indicator:** Use a combination of indicators and analysis techniques to make more informed trading decisions.
By understanding these key concepts and following the practical tips outlined in this guide, beginners can start analyzing crypto market charts and make more informed trading decisions. Remember that practice and experience are essential for developing your skills in crypto market analysis.
Charting & Exchange Resources
| Platform | Use Case | Key Feature | Fee Model | Action |
|---|---|---|---|---|
| TradingView | Charting & technical analysis | Indicators, multi-timeframe charts | Free / Pro tiers | View Platform |
| Coinbase | Exchange (beginner-friendly) | Simple USD on-ramp, educational tools | Varies by region | View Platform |
| Binance | Exchange (advanced pairs) | Wide altcoin coverage, spot markets | Varies by region | View Platform |
Affiliate Disclosure: This post contains affiliate links. We may earn a commission if you buy through our links, at no extra cost to you. Investment Risk Disclaimer: Cryptocurrency and digital asset markets are highly volatile. This content is for informational and educational purposes only and is not financial, investment, or trading advice. You may lose some or all of your capital. Do your own research and consult a licensed financial advisor before making investment decisions.
Leave a Reply