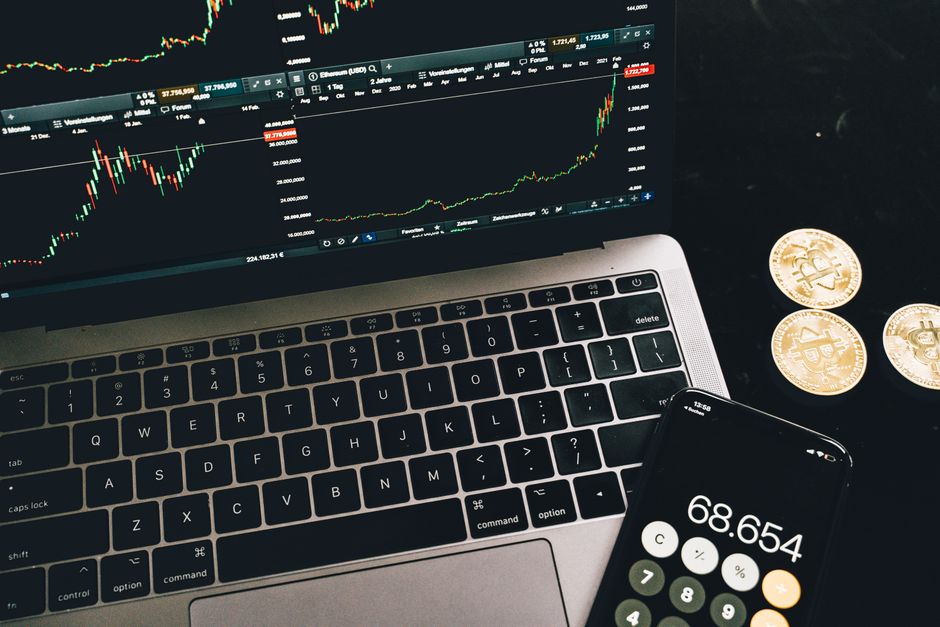
Reading crypto market charts is one of the most practical skills any new investor can develop. Whether you’re evaluating Bitcoin’s recent price action or sizing up an altcoin‘s trend, knowing **how to read crypto market charts for beginners** gives you a structured framework instead of gut-feeling guesses. This guide covers every major concept — from chart types to technical indicators — with plain-language explanations and a clear-eyed look at the risks involved.
> **Risk Disclaimer:** Cryptocurrency markets are highly volatile. Nothing in this article constitutes financial advice. Always consult a qualified financial professional before making investment decisions.
—
Understanding Crypto Market Charts
Market charts are the visual language of trading. They compress thousands of individual transactions into a single price history you can scan in seconds. Crypto charts matter even more than traditional market charts because digital assets trade 24/7, move faster, and lack the circuit-breaker rules that slow down stock markets.
There are three main chart types you’ll encounter:
- **Line charts** — Connect closing prices over time; best for a quick trend overview
- **Bar charts** — Display open, high, low, and close (OHLC) data per period
- **Candlestick charts** — The industry standard; visually encode OHLC data plus buyer and s r momentum
Time frames are equally important. A **short-term trader** might study 5-minute or 1-hour candles, while a **long-term investor** focuses on daily or weekly charts. Beginners should always start with the daily or weekly view to filter out noise before drilling into shorter intervals.
—
Key Chart Patterns and What They Signal
**Candlestick charts** are the foundation of modern crypto technical analysis (TA). Each candle represents a set time period — one hour, one day, one week — and its body shows whether price closed higher (green) or lower (red) than it opened. Long upper “wicks” suggest s rs pushed back against a rally; long lower wicks indicate buyers stepped in during a pullback.
Two of the most critical concepts on any chart are **support** and **resistance**:
- **Support** is a price level where buying interest has historically been strong enough to halt a decline
- **Resistance** is a price level where selling pressure has historically capped advances
- These levels frequently flip roles — old resistance often becomes new support after a confirmed breakout
**Trend lines** connect a series of higher lows (uptrend) or lower highs (downtrend). When combined into **channels**, they define a price corridor that traders watch for breakouts or bounces. A channel break on high trading volume carries more weight than one on thin volume — but even then, it is not a guarantee.
For a broader look at how these patterns fit into current market conditions, see our ongoing [crypto market analysis and trend coverage](https://sieunjayd.blog/category/latest-news/market-analysis/).
—
Technical Indicators for Crypto Market Analysis
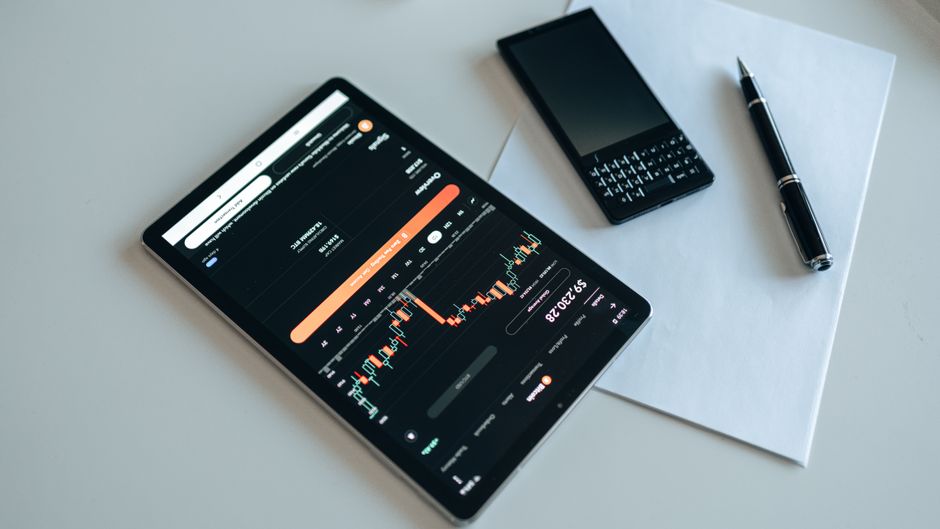
Technical indicators are mathematical calculations layered on top of raw price data. They help traders contextualize what price action means in a broader statistical sense. Three of the most widely used are:
- **Moving Average (MA)** — Smooths price data over a set number of periods (e.g., 50-day MA, 200-day MA). When the shorter MA crosses above the longer one, it is called a **golden cross** — a historically bullish signal. The reverse is a **death cross**.
- **Relative Strength Index (RSI)** — An oscillator measuring the speed and magnitude of price changes on a scale of 0–100. Readings above 70 are generally considered **overbought**; readings below 30 are considered **oversold**. RSI alone should not trigger a trade decision.
- **Bollinger Bands** — A volatility indicator plotting two standard deviations above and below a moving average. When the bands **squeeze** (narrow), it often signals a period of compressed volatility that may precede a sharp directional move.
No single indicator is reliable in isolation. The strongest signals emerge when multiple indicators align — for example, RSI showing oversold conditions while price sits at a well-established support level.
—
Common Trading Strategies in Cryptocurrency Markets
Different strategies use charts in fundamentally different ways. Matching your approach to your schedule and risk tolerance is critical before acting on any chart signal.
- **Day trading and scalping** — Positions open and close within a single day or even minutes. These strategies demand near-constant monitoring and carry high transaction costs.
- **Swing trading** — Positions held for days to weeks, targeting moves between support and resistance. This suits investors who can check charts a few times daily without being screen-bound.
- **Position trading** — Long-duration holds measured in weeks or months, relying on weekly and monthly charts plus fundamental analysis (FA).
| Strategy | Typical Hold Time | Chart Time Frame | Risk Level |
|---|---|---|---|
| Scalping | Minutes to hours | 1-min to 15-min | Very High |
| Day Trading | Intraday | 15-min to 4-hour | High |
| Swing Trading | Days to weeks | 4-hour to Daily | Medium |
| Position Trading | Weeks to months | Daily to Weekly | Lower (relative) |
Beginners are generally better served starting with swing or position trading, where there is more time to think through each decision before acting.
—
Risks and Challenges in Reading Crypto Charts
Charts are a tool, not a crystal ball. The crypto market is uniquely prone to sudden, extreme moves driven by regulatory announcements, exchange failures, or macroeconomic shifts that no chart pattern predicted. **Volatility** in crypto routinely dwarfs equities — a 20% single-day swing that would be catastrophic in stocks is not unusual in altcoins.
Several risks are specific to chart reading itself:
- **Pattern misinterpretation** — The same formation can appear bullish to one analyst and bearish to another depending on broader context
- **Hindsight bias** — Patterns look obvious in retrospect but are far less clear in real time
- **False breakouts** — Price temporarily pierces a support or resistance level before reversing, trapping traders on the wrong side
**Risk management** tools — including stop-loss orders, position sizing limits, and portfolio diversification — are not optional. They are the primary defense against catastrophic losses when a chart read turns out to be wrong.
—
Practical Tips for Beginners Interpreting Crypto Charts
The learning curve is real but manageable with a disciplined approach. These steps build competency without requiring you to risk real capital prematurely.
- **Start with longer time frames** — Daily and weekly charts filter out minute-to-minute noise and reveal cleaner trends
- **Limit yourself to 2–3 indicators** — Overloading your chart creates analysis paralysis; RSI plus one moving average is a solid starting point
- **Use multiple time frames for confirmation** — If the daily chart shows a bullish setup, check the weekly chart to ensure you are not trading against a larger downtrend
- **Paper trade first** — Many exchanges offer simulated trading environments where you can practice chart reading without risking real money
- **Keep a trading journal** — Record why you read a chart a certain way, then review what actually happened; this feedback loop accelerates learning faster than any tutorial
Patience is an underrated skill in chart reading. Most well-grounded decisions come from waiting for high-confidence setups rather than acting on every pattern you identify.
—
Combining Charts with Fundamental and Sentiment Analysis
Charts are only one input into a sound investment decision. **Fundamental analysis (FA)** — which examines a project’s technology, team, tokenomics, and real-world adoption — provides context that pure chart reading cannot supply. A chart might show a coin sitting at a multi-year support level, but if the underlying project lacks a credible use case, that level may simply be the next step on a staircase down.
**Market sentiment** tools like the **Crypto Fear & Greed Index** (a composite measure of social activity, volatility, and market momentum) add qualitative texture to what charts show quantitatively. Historically, extreme fear readings have coincided with better long-term entry opportunities, while extreme greed has often preceded corrections.
**Diversification** remains one of the most evidence-backed risk management principles for US crypto investors. A diversified portfolio might combine large-cap assets like Bitcoin and Ethereum with smaller allocations to higher-risk altcoins. Many US investors also hold non-crypto assets alongside their digital holdings to reduce overall portfolio volatility. You can track how these broader market dynamics are evolving through our [latest market analysis coverage](https://sieunjayd.blog/category/latest-news/market-analysis/).
—
Best Practices for Reading Crypto Market Charts
Developing sound habits early prevents costly mistakes later. The most effective chart readers are not necessarily the most technically sophisticated — they are the most disciplined.
- **Stay current with relevant news** — US regulatory developments (SEC rulings, Congressional hearings), macroeconomic data (Federal Reserve rate decisions), and major exchange news all directly impact crypto price action and can override any technical setup
- **Review and adjust your strategy regularly** — A swing trading approach that performed well in a trending bull market may underperform in sideways or bear conditions; schedule periodic reviews of your overall method
- **Apply risk management tools consistently** — Stop-loss orders, position size caps (many professionals risk no more than 1–2% of total capital per trade), and dollar-cost averaging (DCA) are all available on major US-accessible exchanges
- **Never trade on emotion** — Charts are most useful when interpreted with a calm, systematic mindset; fear and greed are the two forces most responsible for retail traders buying tops and selling bottoms
The goal of reading crypto market charts is not to predict the future with certainty. It is to make better-informed decisions and manage downside risk more effectively than guessing.
—
Risk Disclaimer
Cryptocurrency investments carry significant risk, including the potential loss of your entire principal. Market charts and technical indicators are analytical tools — not guarantees of future performance. This article is for **educational purposes only** and does not constitute personalized financial, investment, legal, or tax advice. Conduct your own due diligence and consult a licensed financial advisor before making any investment decisions.
—
Frequently Asked Questions (FAQ)
What are the most reliable sources for crypto market charts?
Reputable cryptocurrency exchanges and dedicated charting platforms provide real-time OHLC data sourced directly from live order books. Look for platforms that display trading volume alongside price and that document their data sourcing clearly. Cross-referencing two independent sources is a useful habit for any serious chart reader.
How often should I review my crypto charts?
It depends on your strategy. Position traders may review daily or weekly charts once or twice a week. Swing traders typically check 4-hour and daily charts once or twice a day. Day traders monitor charts continuously during active sessions. Over-checking short time frames often leads to overtrading — less frequent reviews tend to produce better outcomes for beginners.
Can reading crypto market charts guarantee profits?
No. Chart analysis is one tool in a broader analytical framework, not a profit guarantee. Even experienced analysts with years of practice face significant uncertainty. The real value of chart reading is improving your **risk-to-reward decisions** — identifying setups where potential upside meaningfully outweighs potential downside — not predicting outcomes with certainty.
What is the best chart type for a beginner to start with?
Candlestick charts on a daily time frame are the recommended starting point. They encode more information per candle than line charts, are the industry standard across professional platforms, and the daily view filters out the noise that overwhelms beginners on shorter time frames.
What does trading volume tell me on a crypto chart?
Volume measures how many units of an asset changed hands during a given period. High volume during a price breakout adds credibility to the move; low volume suggests the breakout may lack conviction and is more susceptible to reversal. Volume is one of the first secondary indicators beginners should learn to read alongside price.
Charting & Exchange Resources
| Platform | Use Case | Key Feature | Fee Model | Action |
|---|---|---|---|---|
| TradingView | Charting & technical analysis | Indicators, multi-timeframe charts | Free / Pro tiers | View Platform |
| Coinbase | Exchange (beginner-friendly) | Simple USD on-ramp, educational tools | Varies by region | View Platform |
| Binance | Exchange (advanced pairs) | Wide altcoin coverage, spot markets | Varies by region | View Platform |
Affiliate Disclosure: This post contains affiliate links. We may earn a commission if you buy through our links, at no extra cost to you. Investment Risk Disclaimer: Cryptocurrency and digital asset markets are highly volatile. This content is for informational and educational purposes only and is not financial, investment, or trading advice. You may lose some or all of your capital. Do your own research and consult a licensed financial advisor before making investment decisions.
Leave a Reply