What is the Altcoin Season Index (ASI)?
The **Altcoin Season Index** is a specialized metric that tracks the performance of alternative cryptocurrencies relative to Bitcoin over a rolling 90-day period. The index measures how many of the top 50 altcoins by market capitalization have outperformed Bitcoin during this timeframe. When 75% or more of the top altcoins outperform Bitcoin, the market is considered to be in “altcoin season.”
This tool serves as a sentiment indicator for crypto traders and investors looking to identify market cycles. The ASI provides a data-driven approach to understanding whether capital is flowing into Bitcoin or spreading across the broader altcoin market. Unlike traditional stock market indexes, the ASI focuses exclusively on relative performance rather than absolute price movements.
Compared to Bitcoin dominance charts or Ethereum-specific metrics, the ASI offers a wider view of the altcoin ecosystem. While Bitcoin dominance shows BTC’s share of total crypto market cap, the ASI reveals actual performance trends across dozens of alternative coins. This makes it particularly useful for identifying rotation patterns between Bitcoin and the broader altcoin market.
Factors Influencing Altcoin Market Trends
**Market sentiment** plays a crucial role in altcoin performance cycles. When investor confidence is high and risk appetite increases, capital typically flows from Bitcoin into higher-risk altcoins seeking larger percentage gains. Conversely, during market uncertainty or downturns, investors often retreat to Bitcoin as a relative safe haven within the crypto space.
Regulatory developments create significant ripples across altcoin markets. US Securities and Exchange Commission enforcement actions, proposed legislation, or regulatory clarity can dramatically shift which altcoins gain favor. Coins classified as securities face different legal challenges than those deemed commodities, affecting their accessibility on US exchanges and institutional adoption prospects.
Technological advancements and real-world adoption drive fundamental value in the altcoin space. Layer-2 scaling solutions, interoperability protocols, and decentralized finance innovations can trigger sustained altcoin rallies. Projects that demonstrate actual usage metrics, developer activity, and enterprise partnerships tend to outperform during altcoin seasons more reliably than hype-driven tokens.
Analyzing the Altcoin Season Index Chart
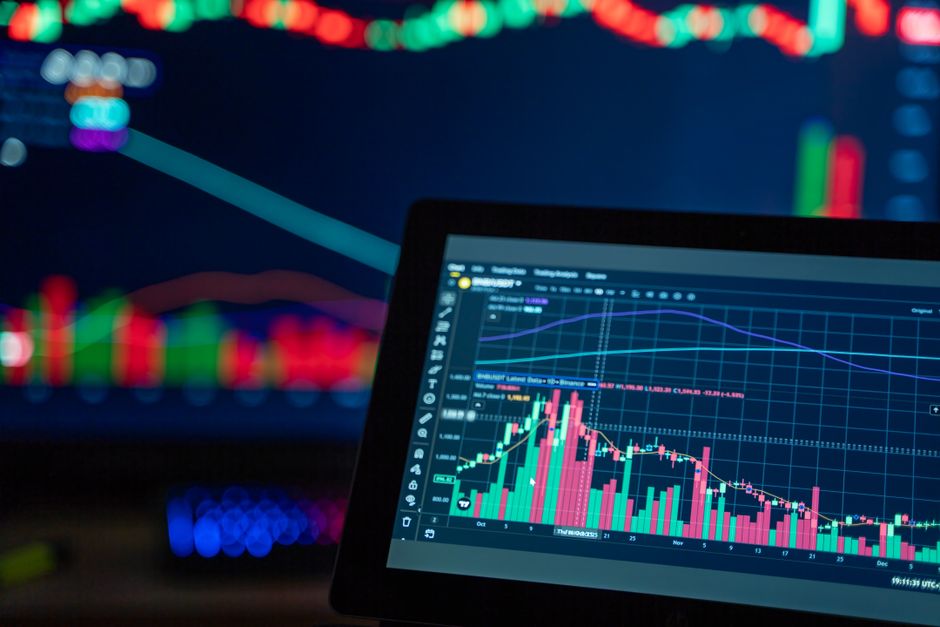
The ASI chart displays a **percentage score from 0 to 100**, representing how many top altcoins have outperformed Bitcoin in the past 90 days. A score above 75 indicates altcoin season, while readings below 25 suggest Bitcoin is dominating market performance. The middle range (25-75) represents a mixed or transitional market environment.
Key data points to monitor include trend direction, momentum, and historical comparison. A rising ASI score signals increasing altcoin strength, while declining readings suggest capital rotation back into Bitcoin. Sharp movements in either direction often precede broader market shifts. Comparing current readings to historical altcoin seasons reveals whether the present cycle matches previous patterns in magnitude and duration.
For short-term trading, rapid changes in the ASI can signal entry or exit points for altcoin positions. A score crossing above 75 after an extended Bitcoin-dominant period may indicate early altcoin season momentum. For long-term investors, sustained high ASI readings (80-90+) historically precede market tops, suggesting increased caution and potential profit-taking opportunities across altcoin holdings.
Risks and Challenges in Altcoin Investing
**High volatility** defines the altcoin market more than any other characteristic. Individual altcoins can experience 20-50% price swings in a single day, with smaller-cap coins showing even more extreme movements. This volatility amplifies both potential gains and losses, making position sizing and risk management critical for survival in this market segment.
The altcoin space remains vulnerable to scams, rug pulls, and market manipulation. Pump-and-dump schemes targeting low-liquidity tokens, fraudulent projects with no real technology, and coordinated manipulation by large holders create substantial risks. US retail investors face particular challenges distinguishing legitimate projects from sophisticated scams that mimic credible ventures.
Thorough research and due diligence cannot be overstated in altcoin investing. Investors should examine project fundamentals including tokenomics, team credentials, code audits, and actual product development. Relying solely on social media hype, influencer endorsements, or price charts without understanding underlying technology and business models significantly increases the probability of losses.
Practical Tips for Using the ASI in Investment Decisions
Combine ASI data with **on-chain metrics** and technical analysis for a comprehensive market view. While the ASI shows relative performance trends, pairing it with Bitcoin dominance charts, total crypto market cap, and exchange flow data provides confirmation signals. Cross-referencing multiple indicators reduces false signals and improves timing accuracy.
Developing a diversified altcoin portfolio mitigates individual project risk while capturing broader market movements. Rather than concentrating heavily in 1-2 altcoins, consider spreading exposure across different sectors (DeFi, layer-1 blockchains, infrastructure, gaming). This approach allows participation in altcoin season rallies while limiting damage from any single project failure.
Timing market entries based on ASI signals requires patience and discipline. Entering altcoin positions when the index crosses above 60-65 (before official altcoin season) can capture early momentum. Setting predetermined exit points when the ASI reaches extreme highs (85-95) helps lock in profits before inevitable corrections. Avoid chasing altcoins after the ASI has already been elevated for extended periods.
Case Studies: Successful Altcoin Investments Using ASI
During the 2020-2021 cycle, traders who monitored the ASI recognized early altcoin season signals in late 2020. As the index climbed from below 25 to above 75, investors who rotated capital from Bitcoin into layer-1 alternatives and DeFi tokens captured substantial gains. Those who exited when the ASI reached extreme readings above 90 in early 2021 preserved profits before the May correction.
A different approach succeeded in 2023 when the ASI displayed choppy, range-bound behavior. Rather than committing heavily during uncertain periods, disciplined investors waited for clear directional breaks. When the index dropped below 30, they accumulated Bitcoin. When it subsequently rallied above 70, they strategically rotated into select altcoins with strong fundamentals, avoiding overexposure during transitional phases.
The consistent lesson from successful ASI-based strategies involves **combining index signals with risk management**. Winners typically used the ASI as one input among several, maintained strict position sizing, and avoided emotional decision-making during extreme readings. They treated altcoin season as a cyclical phenomenon requiring entry and exit discipline rather than a permanent state.
Common Mistakes When Analyzing the Altcoin Season Index Chart
Overreliance on short-term ASI fluctuations leads to whipsaw trades and unnecessary losses. Daily or weekly variations in the index often reflect temporary volatility rather than meaningful trend changes. The 90-day rolling calculation provides inherent smoothing, but traders frequently overreact to minor movements, entering and exiting positions based on noise rather than signal.
Misinterpreting the ASI as a predictive tool rather than a descriptive indicator causes poor timing decisions. The index tells you what has happened over the past 90 days, not what will happen next. Assuming an ASI reading of 80 guarantees continued altcoin outperformance ignores that markets are forward-looking and often reverse precisely when sentiment indicators reach extremes.
Failing to account for external factors undermines ASI-based analysis. Regulatory announcements, macroeconomic shifts, or major security breaches can override technical patterns and index readings. The ASI operates within the context of broader crypto and traditional financial markets. Ignoring Federal Reserve policy, US dollar strength, or geopolitical events while focusing exclusively on the ASI creates blind spots in market assessment.
Investment Risk Disclaimer
**Cryptocurrency investing carries substantial risk** and may not be suitable for all investors. Altcoins are highly volatile assets that can lose significant value rapidly. The information in this article is educational and analytical in nature and does not constitute financial advice, investment recommendations, or a solicitation to buy or sell any cryptocurrency. Past performance of the Altcoin Season Index or individual cryptocurrencies does not guarantee future results. Always conduct your own research, understand your risk tolerance, and consider consulting with a qualified financial advisor before making investment decisions. Never invest more than you can afford to lose entirely.
Frequently Asked Questions
What is the difference between the Altcoin Season Index and other cryptocurrency market indexes?
The Altcoin Season Index specifically measures relative performance of the top 50 altcoins against Bitcoin over 90 days, focusing on how many have outperformed BTC. Bitcoin Dominance charts show BTC’s percentage of total crypto market capitalization, while the Fear and Greed Index measures overall market sentiment. The ASI uniquely identifies rotation between Bitcoin and altcoins rather than absolute price movements or market share, making it a specialized tool for understanding capital flows within the crypto ecosystem.
How often is the Altcoin Season Index updated?
The Altcoin Season Index updates continuously in real-time as price data changes across tracked cryptocurrencies. The calculation uses a rolling 90-day window, meaning each day the oldest day drops off and the newest day is added. Most ASI tracking websites refresh their displays every few minutes to hourly. Staying current with daily readings helps identify trend changes early, though the 90-day calculation period means dramatic single-day shifts are relatively rare unless accompanied by major market events.
Can the Altcoin Season Index be used for short-term or long-term investment strategies?
The ASI serves both timeframes with different applications. Short-term traders use rapid ASI movements and threshold crossings (especially above 75 or below 25) as momentum signals for swing trades lasting days to weeks. Long-term investors monitor extended ASI trends to make strategic allocation shifts between Bitcoin and altcoin exposure over months or quarters. However, the 90-day rolling calculation makes it less effective for day trading and most useful for identifying multi-week to multi-month market phases rather than intraday opportunities.
Charting & Exchange Resources
| Platform | Use Case | Key Feature | Fee Model | Action |
|---|---|---|---|---|
| TradingView | Charting & technical analysis | Indicators, multi-timeframe charts | Free / Pro tiers | View Platform |
| Coinbase | Exchange (beginner-friendly) | Simple USD on-ramp, educational tools | Varies by region | View Platform |
| Binance | Exchange (advanced pairs) | Wide altcoin coverage, spot markets | Varies by region | View Platform |
Affiliate Disclosure: This post contains affiliate links. We may earn a commission if you buy through our links, at no extra cost to you. Investment Risk Disclaimer: Cryptocurrency and digital asset markets are highly volatile. This content is for informational and educational purposes only and is not financial, investment, or trading advice. You may lose some or all of your capital. Do your own research and consult a licensed financial advisor before making investment decisions.
Leave a Reply