crypto market analysis: market-analysis: Understanding

Understanding Crypto Market Charts
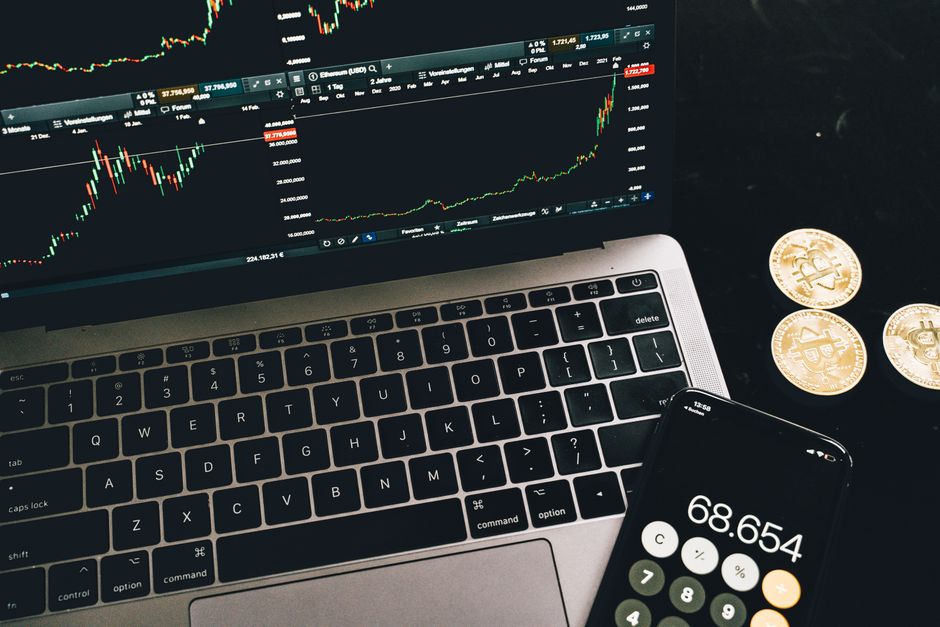
Reading cryptocurrency market charts is a foundational skill for anyone entering the digital asset space. Charts visualize price movements, trading volume, and market sentiment in real time, allowing traders and investors to make data-driven decisions rather than relying on speculation. Without understanding how to interpret these visual tools, beginners risk making emotional trades based on hype or fear rather than objective market signals.
Every crypto market chart contains several key components that work together to tell the story of an asset’s performance. The **price axis** (typically on the right side) shows the current and historical value of the cryptocurrency, while the **time axis** (along the bottom) displays the period over which data is measured—ranging from minutes to years. The **candlestick or line graph** in the center represents actual price movement, and the **volume bars** at the bottom indicate how much of the asset changed hands during each time period.

Most major cryptocurrency exchanges like Coinbase, Binance, and Kraken provide free built-in charting tools accessible directly from their trading interfaces. Third-party platforms such as TradingView and CoinGecko offer more advanced features and allow users to compare multiple assets simultaneously. For beginners, starting with the native exchange charts is often the simplest path, as they integrate seamlessly with your trading account and provide real-time data without additional subscriptions.
Interpreting Price and Volume Data
Price trends form the backbone of technical analysis and reveal whether an asset is gaining or losing value over time. An **uptrend** occurs when a cryptocurrency makes higher highs and higher lows consecutively, signaling bullish momentum. A **downtrend** shows lower highs and lower lows, indicating bearish pressure. Sideways or **range-bound** movement suggests indecision in the market, where neither buyers nor s rs have clear control.
Trading volume measures the total amount of a cryptocurrency bought and sold during a specific period, and it serves as a confirmation tool for price movements. High volume during an uptrend suggests strong buyer interest and validates the price increase. Conversely, a price spike on low volume may indicate a temporary anomaly rather than sustained momentum. Volume spikes often precede major price moves, making it a critical early-warning indicator for both breakouts and breakdowns.
**Support levels** represent price points where buying interest is strong enough to prevent further declines, acting as a floor beneath the market. **Resistance levels** are the opposite—price ceilings where selling pressure prevents further gains. Identifying these levels helps traders anticipate potential reversal zones and set strategic entry or exit points. When price breaks through resistance with strong volume, that level often becomes the new support, and vice versa.
Analyzing Technical Indicators
Technical analysis uses mathematical formulas applied to historical price and volume data to forecast future movements. Unlike fundamental analysis, which examines a project’s technology, team, and use case, technical analysis focuses purely on market behavior patterns. For crypto traders, technical indicators serve as objective tools to filter out noise and identify high-probability trade setups in volatile markets.
**Moving averages** smooth out price data by calculating the average closing price over a specific number of periods, making trends easier to spot. The **simple moving average (SMA)** gives equal weight to all data points, while the **exponential moving average (EMA)** prioritizes recent prices for faster signals. The 50-day and 200-day moving averages are widely watched; when the 50-day crosses above the 200-day (a “golden cross”), it signals potential bullish momentum.
The **Relative Strength Index (RSI)** measures momentum on a scale of 0 to 100, helping traders identify overbought or oversold conditions. An RSI above 70 suggests an asset may be overvalued and due for a correction, while an RSI below 30 indicates potential undervaluation and a buying opportunity. The **Moving Average Convergence Divergence (MACD)** tracks the relationship between two moving averages, generating buy or sell signals when its lines cross. **Bollinger Bands** plot standard deviations around a moving average, expanding during volatility and contracting during calm periods—price touching the outer bands often precedes reversals.
Recognizing Chart Patterns
Chart patterns are visual formations created by price movements that historically tend to resolve in predictable ways. Traders use these recurring shapes to anticipate whether the current trend will continue or reverse. While no pattern guarantees outcomes, they improve the probability of successful trades when combined with volume analysis and other indicators.
The **head and shoulders** pattern signals a potential trend reversal from bullish to bearish, featuring three peaks where the middle peak (the head) is highest and flanked by two lower peaks (the shoulders). An inverse head and shoulders indicates the opposite—a reversal from bearish to bullish. **Triangle patterns** (ascending, descending, and symmetrical) represent consolidation phases where price coils between converging trendlines before breaking out in one direction, usually continuing the prior trend.
**Wedge patterns** are similar to triangles but slope against the prevailing trend, often signaling exhaustion and imminent reversal. Rising wedges during uptrends are bearish, while falling wedges in downtrends are bullish. **Flag and pennant patterns** are short-term continuation signals that appear as brief pauses in strong trends, resembling a flag on a pole. These patterns typically resolve quickly, with price continuing in the original trend direction.
Analyzing Time Frames and Cycles
Cryptocurrency markets operate 24/7, and the time frame you choose for analysis dramatically affects the signals you receive. **Short-term charts** (1-minute to 1-hour) capture rapid price fluctuations ideal for day traders and scalpers seeking quick profits. **Medium-term charts** (4-hour to daily) suit swing traders holding positions for days or weeks. **Long-term charts** (weekly to monthly) provide the big-picture perspective essential for investors building multi-year positions.
Market cycles reflect the psychological phases investors experience collectively: accumulation (smart money buying quietly), markup (public participation driving prices higher), distribution (smart money exiting), and markdown (public panic selling). Crypto markets historically follow roughly four-year cycles correlated with Bitcoin’s halving events, which reduce new supply and have preceded major bull runs in 2013, 2017, and 2021.
Using multiple time frames simultaneously helps traders avoid false signals. A bullish setup on a 1-hour chart carries more weight if the daily and weekly charts also show uptrends. This **top-down analysis** approach starts with long-term charts to establish the overall trend direction, then zooms into shorter time frames for precise entry timing. Never trade counter to the higher time frame trend unless you have clear reversal confirmation.
Risk Management in Crypto Trading
Cryptocurrency markets exhibit extreme volatility, with double-digit percentage swings occurring regularly—even in established assets like Bitcoin and Ethereum. This volatility creates profit opportunities but also substantial risk of capital loss. Events like regulatory announcements, exchange hacks, or macroeconomic shifts can trigger cascading liquidations and flash crashes that obliterate poorly managed positions within minutes.
Effective risk management begins with **position sizing**—never allocating more than 1-2% of your total capital to a single trade. This ensures that even a string of losses won’t devastate your portfolio. **Stop-loss orders** automatically close positions when price reaches a predetermined level, limiting downside exposure. Setting stops just beyond support levels protects against normal volatility while exiting if the trend breaks.
Diversification across multiple cryptocurrencies and asset classes reduces concentration risk, though over-diversification can dilute returns. Maintain an emergency fund in stablecoins or fiat to avoid forced selling during market downturns. Never invest money you cannot afford to lose entirely, and avoid using leverage until you have demonstrated consistent profitability with unleveraged trades. Emotional discipline separates successful traders from those who blow up accounts—stick to your trading plan regardless of short-term market noise.

Practical Steps for Beginners
Starting your chart analysis journey requires setting up accounts on reputable cryptocurrency exchanges that offer robust charting tools. Coinbase Pro, Kraken, and Binance provide free access to professional-grade charts with essential indicators pre-installed. For more advanced features, create a free TradingView account, which allows custom indicator combinations, alerts, and social features where traders share analysis.
Begin by studying a single cryptocurrency’s daily chart for several weeks without making trades, simply observing how price responds to support and resistance levels. Add one indicator at a time—starting with a 50-day moving average—and note how price behavior changes relative to it. Resist the temptation to clutter charts with dozens of indicators, as this creates conflicting signals and “analysis paralysis.” Most professional traders use no more than three to four indicators simultaneously.
**Paper trading** lets you practice reading charts and executing trades with virtual money, building confidence and refining your strategy without financial risk. Track every trade in a journal, recording your entry reasoning, exit plan, and emotional state. Review this journal weekly to identify patterns in your decision-making—both successful and flawed. Only graduate to real money trading after achieving consistent profitability in your paper account for at least three months.
Advanced Techniques for Experienced Traders
Once you’ve mastered single-indicator analysis, combining multiple indicators creates more robust trading systems with fewer false signals. **Confluence** occurs when several independent indicators align—for example, price testing a major support level while RSI shows oversold conditions and MACD generates a bullish crossover. Trades with multiple confluence factors have statistically higher success rates than those based on a single signal.
**Multi-time frame analysis** involves checking three different time frames before entering a trade: a long-term chart for overall trend direction, a medium-term chart for intermediate structure, and a short-term chart for precise entry timing. This approach filters out noise and ensures you’re trading with the dominant trend rather than against it. Professional traders often monitor daily, 4-hour, and 15-minute charts simultaneously.
Integrating **on-chain metrics** like active addresses, exchange inflows/outflows, and miner behavior adds a fundamental dimension to technical analysis. Large exchange inflows often precede selling pressure, while accumulation addresses holding coins for extended periods signal long-term confidence. Platforms like Glassnode and CryptoQuant provide this data, allowing advanced traders to anticipate major moves before they appear on price charts. Combining traditional technical analysis with blockchain-specific data creates a comprehensive trading edge unavailable in traditional markets.
Investment Risk Disclaimer
Cryptocurrency trading and investment carry substantial risk of financial loss. Digital asset prices are highly volatile and can experience rapid, unpredictable changes in value. Past performance of any cryptocurrency does not guarantee future results. This article provides educational information only and does not constitute financial, investment, tax, or legal advice. You should conduct your own research and consult with qualified financial professionals before making any investment decisions. Never invest more than you can afford to lose completely, as cryptocurrency markets can and do experience total value destruction of individual assets. The information presented reflects general market analysis techniques and should not be interpreted as recommendations to buy, sell, or hold any specific cryptocurrency.
Frequently Asked Questions (FAQ)
What are the most important factors to consider when reading crypto market charts?
The three most critical factors are **trend direction** (is the asset moving up, down, or sideways over your chosen time frame), **volume confirmation** (are price moves supported by strong trading activity), and **key support and resistance levels** (where has price historically reversed or stalled). Beginners should focus on these foundational elements before adding complex indicators. Always consider the broader market context—Bitcoin’s movement heavily influences most altcoins, so checking BTC’s chart provides essential context for other cryptocurrency trades. Time frame alignment matters as well; ensure your chart analysis matches your actual trading or investment horizon rather than mixing day-trading signals with long-term holding strategies.
How often should I analyze market charts for my crypto trading?
Analysis frequency depends entirely on your trading style and time frame. **Day traders and scalpers** monitor charts continuously during active trading sessions, watching for minute-to-minute opportunities. **Swing traders** typically review charts once or twice daily, checking for new developments without obsessing over short-term noise. **Long-term investors** benefit from weekly or monthly reviews, focusing on major trend changes rather than daily fluctuations. Regardless of style, avoid the trap of constant chart-watching when you have no open positions or actionable setups—this leads to overtrading and emotional decision-making. Set price alerts for key levels instead, allowing charts to notify you when genuine opportunities emerge rather than staring at screens hoping for action.
What are the common mistakes beginners make when reading market charts?
The most frequent beginner error is **using too many indicators simultaneously**, creating conflicting signals and confusion rather than clarity. New traders often add every available indicator to their charts, hoping more tools equal better results, when in reality two or three well-understood indicators outperform a dozen poorly understood ones. Another critical mistake is **ignoring time frame alignment**—trading based on 5-minute chart signals while claiming to be a long-term investor, or vice versa. Beginners also frequently **chase breakouts** without waiting for volume confirmation or retest of new levels, entering at the worst possible moment as momentum exhausts. Finally, many new traders **fail to mark key support and resistance zones** before price reaches them, forcing reactive rather than planned decision-making during emotional market moments.
Charting & Exchange Resources
| Platform | Use Case | Key Feature | Fee Model | Action |
|---|---|---|---|---|
| TradingView | Charting & technical analysis | Indicators, multi-timeframe charts | Free / Pro tiers | View Platform |
| Coinbase | Exchange (beginner-friendly) | Simple USD on-ramp, educational tools | Varies by region | View Platform |
| Binance | Exchange (advanced pairs) | Wide altcoin coverage, spot markets | Varies by region | View Platform |
Affiliate Disclosure: This post contains affiliate links. We may earn a commission if you buy through our links, at no extra cost to you. Investment Risk Disclaimer: Cryptocurrency and digital asset markets are highly volatile. This content is for informational and educational purposes only and is not financial, investment, or trading advice. You may lose some or all of your capital. Do your own research and consult a licensed financial advisor before making investment decisions.
