Crypto Market Analysis: A Practical Guide for Investors

What Is Crypto Market Analysis?
Crypto market analysis is the systematic process of evaluating cryptocurrency assets using data, trends, and measurable indicators to guide investment decisions. Unlike traditional financial markets that operate during fixed hours on weekdays, the cryptocurrency market runs 24 hours a day, seven days a week across global exchanges. This constant availability creates unique opportunities and risks that make disciplined market analysis essential for anyone holding or considering digital assets.
**Market capitalization** represents the total dollar value of a cryptocurrency in circulation, calculated by multiplying the current price by the number of coins or tokens outstanding. **Trading volume** measures how actively an asset is being bought and sold over a given period, and **liquidity** describes how easily an asset can be converted to cash without significantly moving its price. Understanding these three metrics forms the foundation of any serious market analysis approach.

Acronyms like MACD (Moving Average Convergence Divergence), RSI (Relative Strength Index), and VWAP (Volume Weighted Average Price) appear constantly in trading circles, so this guide will define every term on first use. The goal is to give US investors a clear, practical framework for evaluating crypto markets responsibly and with full awareness of the risks involved.
—
Fundamental Analysis: Finding Intrinsic Value
**Fundamental analysis** evaluates the underlying worth of a cryptocurrency by examining factors that drive its long-term value, rather than focusing solely on short-term price movements. This approach answers the question: is this asset genuinely valuable, or is its price inflated by hype?
Key factors in fundamental analysis include the **strength and maturity of the underlying technology**, the **development team’s track record and roadmap**, **real-world adoption rates and active user growth**, and the **regulatory environment** surrounding the asset. On-chain metrics like active wallet addresses, daily transaction counts, and network utility provide concrete signals about whether a project has genuine use cases.
**Bitcoin (BTC)** offers a useful example. In late 2017, Bitcoin’s price surge was driven partly by genuine adoption but also by speculative frenzy. By contrast, its post-2020 bull run was supported by institutional adoption, clearer regulatory frameworks, and growing mainstream acceptance as a store-of-value asset. Understanding these differences illustrates why fundamentals matter.
- Evaluate the technology: Is the blockchain scalable, secure, and genuinely useful?
- Review the team: Does the development group have a credible, deliverable roadmap?
- Check adoption metrics: Are active addresses and transaction volumes growing?
- Monitor regulatory news: How are governments treating this asset class?
**Important note:** Fundamental analysis helps with long-term positioning but does not guarantee any specific price outcome. Cryptocurrencies can remain overvalued or undervalued for extended periods due to speculative demand.
—
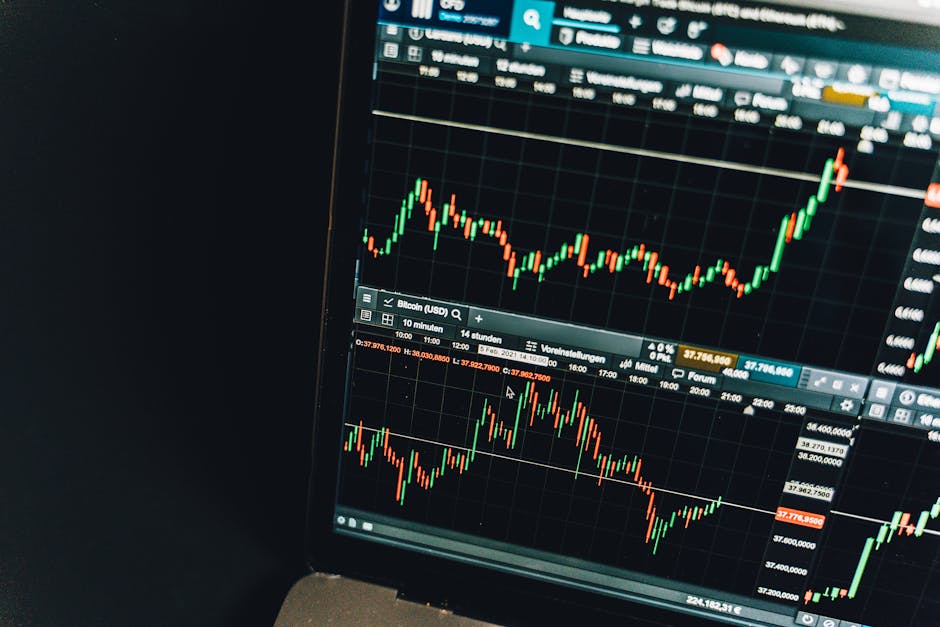
Technical Analysis: Reading Price Charts
**Technical analysis** studies historical price movements and trading volume data to identify patterns that may suggest future price direction. While this approach does not predict the future, it helps traders recognize trends and make more informed decisions about entry and exit points.
Common technical tools include **trend lines** that connect price highs and lows, **moving averages** that smooth out price data over set periods, the **RSI (Relative Strength Index)** which measures whether an asset is overbought or oversold, the **MACD (Moving Average Convergence Divergence)** which identifies changes in momentum, and **Fibonacci retracement levels** which mark potential support and resistance zones.
**Bitcoin (BTC)** frequently serves as an example in technical analysis discussions. A sustained break above its 200-day moving average historically signals a shift from bearish to bullish momentum, while extended periods below this line suggest continued downward pressure.
Technical analysis has real limitations. Past patterns do not guarantee future results, and technical signals can fail completely during unexpected events like regulatory announcements or macroeconomic shocks. Professional traders use technical analysis alongside fundamental analysis, never as a standalone strategy.
—
Sentiment Analysis: Gauging Market Psychology
**Sentiment analysis** examines the psychological and emotional forces driving market movements by tracking social media activity, news coverage, and forum discussions. In cryptocurrency markets, where individual investor behavior heavily influences price, understanding crowd sentiment provides a distinct analytical advantage.
The **Fear & Greed Index** aggregates multiple sentiment signals into a single daily reading, ranging from 0 (extreme fear) to 100 (extreme greed). When the index reaches extreme fear, it may signal buying opportunities as prices fall below fair value. When it reaches extreme greed, it may warn of overheated conditions and potential corrections.
**Social sentiment indicators** track activity on platforms like Reddit, Twitter (X), and Telegram to measure bullish versus bearish commentary. Unusual spikes in social activity often coincide with significant price movements, whether triggered by news events or coordinated campaigns.
Whale wallets—large cryptocurrency holdings tracked through blockchain analytics—reveal when institutional or large retail holders are accumulating or distributing assets. Platforms like Whale Alert provide real-time alerts on large transactions.
The critical insight is that sentiment creates feedback loops with price action. Rising prices generate bullish sentiment, attracting more buyers and pushing prices higher. Falling prices create fear and bearish sentiment, triggering further selling. Recognizing when sentiment reaches extreme levels helps traders avoid emotional decisions.
—
Reliable Data Sources for Crypto Analysis
High-quality data is the foundation of effective market analysis. US investors have access to several categories of reliable data sources that serve different analytical purposes.
**Centralized cryptocurrency exchanges** like Coinbase, Kraken, and Gemini provide real-time price feeds, trading volume data, and order book depth information. These platforms are regulated in the US to varying degrees, making them among the most trustworthy sources for price and volume data. Always compare data across at least two exchanges to account for discrepancies.
**Blockchain explorers** like Etherscan for Ethereum or Blockchain.com for Bitcoin provide transparent on-chain data that cannot be manipulated since every transaction is recorded permanently on the blockchain. These tools allow investors to verify actual trading activity independently.
**Aggregators** such as CoinGecko and CoinMarketCap compile data from multiple exchanges into unified dashboards. However, note that many centralized exchanges have historically inflated their reported volume numbers. Cross-referencing on-chain data from blockchain explorers provides a more accurate picture of true market activity.
—
Risks and Challenges in Crypto Market Analysis
Cryptocurrency markets present unique analytical challenges that every investor must understand before making financial decisions.
**Extreme volatility** remains the defining characteristic of digital assets. Bitcoin has experienced 30–50% drawdowns during major market cycles, while smaller altcoins routinely see 70–90% corrections. This level of price instability means that stop-loss orders, disciplined position sizing, and thoughtful portfolio allocation are not optional—they are essential risk management practices.
**Market manipulation** is a documented problem in crypto spaces. Wash trading (artificially inflating volume), coordinated social media campaigns, and pump-and-dump schemes targeting low-liquidity altcoins are all real threats. Even mid-cap cryptocurrencies can experience sudden price swings triggered by well-coordinated campaigns.
**Cognitive biases** further compromise analytical accuracy. Confirmation bias leads analysts to seek information supporting existing beliefs. Survivorship bias makes successful crypto investors appear more common than they are. Recency bias causes overweighting of recent events over long-term trends.
—
Analyzing Cryptocurrency Trading Patterns
Understanding chart patterns and trading signals helps investors interpret market behavior and make more disciplined decisions.

**Support and resistance levels** are horizontal price zones where historical buying or selling pressure has been strong enough to pause or reverse price movements. Support is the floor where demand historically absorbs selling pressure, while resistance is the ceiling where supply absorbs buying pressure. When a support level breaks, it often becomes resistance, and vice versa.
Bitcoin’s psychological $42,000 support level in 2021 illustrates how institutional buyers often concentrate orders around round-number price points, making these levels especially significant.
**Volume analysis** confirms the strength of price movements. A breakout above resistance on high volume signals genuine conviction, while the same breakout on low volume suggests the move may not sustain. Monitoring volume concentration across price levels reveals where institutional interest clusters.
**Candlestick patterns** reveal the psychology of buyers and s rs at specific price moments. A **doji** signals market indecision, a **hammer** suggests buyers stepped in after a decline, and **engulfing patterns** show control shifting from one side to the other.
| Pattern | Meaning | Action Consideration |
|---|---|---|
| Doji | Market indecision | Wait for confirmation |
| Hammer | Potential bullish reversal | Confirm with volume |
| Engulfing | Momentum shift | Watch for follow-through |
| Head and Shoulders | Possible reversal | Validate with other indicators |
—
Sentiment’s Role in Driving Crypto Markets
Collective emotions like fear, greed, and speculative enthusiasm create feedback loops that drive cryptocurrency prices independently of fundamentals. Understanding this dynamic is critical for long-term investment success.
During bullish cycles, positive sentiment attracts new retail investors, creating self-reinforcing price appreciation. During bearish cycles, fear spreads through social media, triggering panic selling that accelerates price declines. These emotional swings are amplified by social media algorithms that prioritize engagement-driving content.
Practical tools for tracking sentiment include the **Crypto Fear & Greed Index** from Alternative.me, **Santiment** for on-chain and social metrics, **LunarCrush** for social media activity analysis, and **CoinMarketCap sentiment data**. These platforms aggregate data from multiple sources to provide actionable sentiment readings.
—
Practical Applications for Investors
Combining fundamental, technical, and sentiment analysis creates a comprehensive framework for making investment decisions in cryptocurrency markets.
**Timing entries and exits** using support and resistance levels helps investors avoid buying at local highs and selling at local lows. Waiting for confirmed breakouts above resistance on healthy volume reduces the risk of entering during false breakouts.
**Position sizing** should reflect the volatility of each asset. Higher-volatility assets like altcoins warrant smaller position sizes relative to more established assets like Bitcoin or Ethereum.
**Portfolio allocation** across different market capitalizations balances growth potential with stability. Many experienced crypto investors maintain the majority of their holdings in large-cap assets while allocating smaller percentages to mid-cap and small-cap opportunities.
—
Case Studies: Analysis in Action
Real-world examples demonstrate how analytical frameworks work across different market conditions and assets.
**Bitcoin’s major market cycles** from 2017 through the post-halving period in 2020–2021 show how fundamental analysis, on-chain metrics, and technical signals all contributed to understanding market dynamics. The 2017 cycle was characterized by speculative retail frenzy, while the 2020–2021 cycle was supported by institutional adoption, clear regulatory developments, and strong on-chain growth metrics.
**Ethereum (ETH)** demonstrates how qualitative factors influence price over time. Its transition to proof-of-stake, the explosion of DeFi (decentralized finance) and NFT ecosystems, and growing institutional interest all contributed to significant price appreciation. Yet Ethereum also experienced an approximately 90% drawdown from its 2018 peak, demonstrating that strong fundamentals do not eliminate volatility risk.
**Ripple (XRP)** illustrates how regulatory uncertainty can dominate price outcomes regardless of technical merit. The SEC lawsuit created persistent regulatory headwinds that suppressed XRP’s price performance despite the project’s technical strengths and global banking partnerships.
—
Risk Disclaimer
Cryptocurrency markets are highly volatile, speculative, and risky. All investments in digital assets can result in significant losses, including the total loss of principal. Market analysis tools and frameworks provide informational insights only—they do not guarantee any specific outcome or predict future prices. Before investing in any cryptocurrency, individuals should consult with a qualified financial advisor and conduct their own independent research. This article does not constitute personalized financial or investment advice.
—
Frequently Asked Questions (FAQ)
What makes crypto market analysis different from traditional market analysis?
Crypto market analysis differs from traditional market analysis in several key ways. First, cryptocurrency markets operate 24/7 without the circuit breakers or trading halts found in traditional stock markets. Second, no single centralized exchange or regulatory body collects and reports reliable volume data, making accurate market measurement more challenging. Third, on-chain metrics like active addresses and transaction volumes are publicly available for blockchain assets in ways that have no direct equivalent for traditional securities. Fourth, the relative youth and lower liquidity of crypto markets make them more susceptible to manipulation, sentiment swings, and extreme volatility than established traditional markets.
How can blockchain data help analyze cryptocurrency markets?
Blockchain data provides transparent, publicly verifiable metrics that cannot be manipulated since every transaction is permanently recorded on-chain. Investors use blockchain explorers like Etherscan or Blockchain.com to track active addresses, daily transaction counts, exchange inflows and outflows, and whale wallet movements. Advanced analytics platforms like Glassnode provide institutional-grade on-chain analytics including staking rates, exchange reserves, and realized capitalization. These tools help investors understand actual network activity rather than relying solely on reported exchange data.
What are reliable sources for crypto sentiment analysis?
Reliable sentiment analysis sources include the **Crypto Fear & Greed Index** from Alternative.me, **Santiment** for on-chain and social metrics, **LunarCrush** for social media activity analysis, and **CoinMarketCap sentiment data**. These platforms aggregate social media discussions, news coverage, search trends, and on-chain signals to provide actionable sentiment readings. Used alongside technical and fundamental analysis, sentiment tools help investors understand crowd behavior without treating sentiment data as a direct trading signal. Comparing multiple sources provides a more balanced picture of overall market sentiment.
Charting & Exchange Resources
| Platform | Use Case | Key Feature | Fee Model | Action |
|---|---|---|---|---|
| TradingView | Charting & technical analysis | Indicators, multi-timeframe charts | Free / Pro tiers | View Platform |
| Coinbase | Exchange (beginner-friendly) | Simple USD on-ramp, educational tools | Varies by region | View Platform |
| Binance | Exchange (advanced pairs) | Wide altcoin coverage, spot markets | Varies by region | View Platform |
Affiliate Disclosure: This post contains affiliate links. We may earn a commission if you buy through our links, at no extra cost to you. Investment Risk Disclaimer: Cryptocurrency and digital asset markets are highly volatile. This content is for informational and educational purposes only and is not financial, investment, or trading advice. You may lose some or all of your capital. Do your own research and consult a licensed financial advisor before making investment decisions.
