Market Analysis: Understanding Cryptocurrency Market Trends
The cryptocurrency market remains one of the most dynamic and rapidly evolving asset classes available to US investors today. With thousands of digital tokens trading across dozens of exchanges, understanding cryptocurrency market-analysis is no longer optional for anyone serious about navigating this space. Unlike traditional stock markets, crypto operates around the clock, meaning price movements can happen at any hour and are often amplified by global events, regulatory announcements, and social media sentiment. This article breaks down everything you need to know about analyzing cryptocurrency markets — from the foundational metrics that drive valuations to the technical tools that help you read chart patterns. Whether you are a first-time crypto buyer or a seasoned portfolio manager, the principles covered here apply equally. Always keep in mind that cryptocurrency investments carry significant risk, and nothing in this guide constitutes personalized financial advice.
Cryptocurrency Market Overview
Cryptocurrency market-analysis refers to the process of evaluating digital asset markets using a combination of data, indicators, and contextual information to make informed decisions. At its core, it involves studying price history, trading volume, blockchain activity, and broader economic factors that influence supply and demand for crypto assets. The importance of understanding market trends cannot be overstated — the crypto space is notoriously volatile, with individual tokens capable of moving 10%, 20%, or even 50% in a single day. The current cryptocurrency market encompasses a wide spectrum of assets, from large-cap tokens like Bitcoin (BTC) and Ethereum (ETH) to thousands of smaller altcoins with varying levels of liquidity and risk. Market capitalization — the total value of all tokens in circulation — serves as a useful benchmark for comparing the relative size of different projects. Trading volume, which measures how much of an asset changes hands in a given period, indicates market interest and can signal potential trend strength or weakness.
Types of Cryptocurrency Market Analysis
Professional analysts and traders generally group market-analysis approaches into three distinct categories. **Fundamental analysis (FA)** examines the intrinsic value of a cryptocurrency by evaluating the underlying technology, the strength of the development team, real-world adoption, and overall market potential. **Technical analysis (TA)** focuses on historical price data and trading volume to identify patterns and predict future price movements. **Sentiment analysis** studies the mood of the market by monitoring social media, news coverage, and broader community discussions to gauge whether participants are bullish or bearish. Most serious market analysts use a combination of all three approaches rather than relying on any single method. No one method is foolproof, and each comes with its own limitations. Understanding the strengths and weaknesses of each approach helps you build a more complete picture of market conditions before making any investment decision.
Fundamentals of Cryptocurrency Market Analysis
Fundamental analysis forms the bedrock of long-term investment decisions in the crypto space. Several key metrics deserve close attention. **Market capitalization** is calculated by multiplying the current price of a token by its total circulating supply — a higher market cap generally indicates a more established asset, though it does not tell the whole story. **Trading volume** measures how actively an asset is being bought and sold, with higher volume typically signaling stronger institutional interest and tighter bid-ask spreads. Beyond these surface-level numbers, serious analysts dig into the underlying blockchain technology itself — evaluating factors like transaction throughput, decentralization metrics, smart contract security audit results, and roadmap progress. The development team behind a project matters enormously: a transparent, credentialed team with a documented history of delivering on milestones tends to inspire more confidence than anonymous or unproven developers. Finally, adoption and real-world use cases deserve deep scrutiny — does the token solve a genuine problem? Are there strategic partnerships in place? What does the regulatory environment look like for the project’s target market?
Technical Analysis Techniques
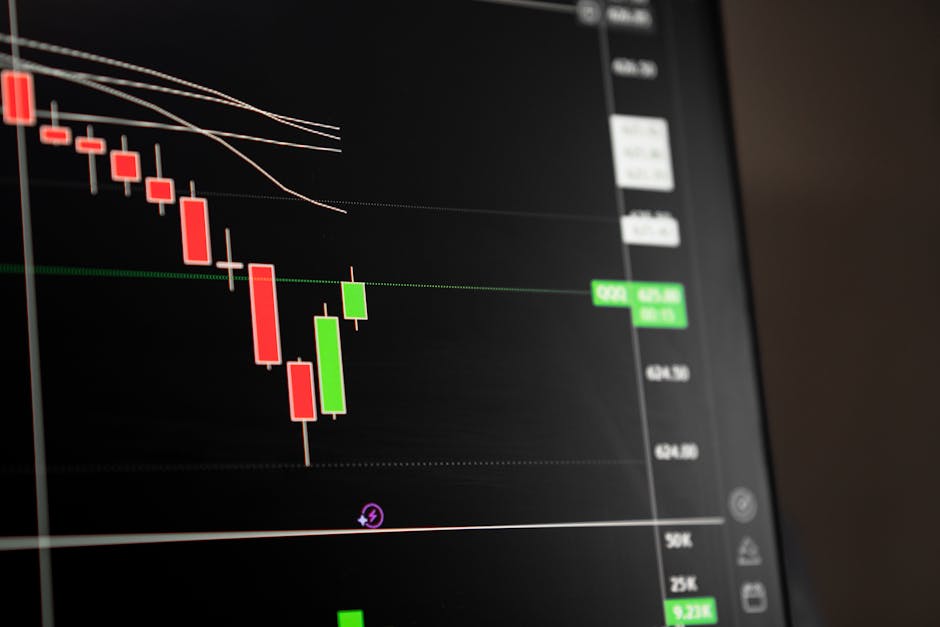
**Technical analysis (TA)** is the practice of studying past market data — primarily price and volume — to forecast future price movements. Chart patterns are visual formations that emerge from historical price action and are believed to repeat over time. Common patterns include head and shoulders, double tops and bottoms, and ascending triangles, each carrying its own implied significance for future price direction. **Trading indicators** are mathematical calculations applied to price and volume data to provide additional context. The most widely used include:
| Indicator | Type | What It Measures |
|---|---|---|
| Moving Averages (MA) | Trend | Average price over a set period — 50-day and 200-day MAs are most common |
| Relative Strength Index (RSI) | Momentum | Whether an asset is overbought (above 70) or oversold (below 30) |
| MACD | Momentum | Relationship between two moving averages for trend strength |
| Bollinger Bands | Volatility | Price range boundaries that expand and contract with market volatility |
| Volume Profile | Volume | Trading activity at specific price levels |
**Candlestick patterns** provide visual cues about buyer-s r dynamics within individual time periods. Patterns such as doji candles, engulfing candles, and hammer formations can hint at potential reversals or continuations, though they should never be used in isolation. Importantly, technical analysis does not produce certainties — it offers probabilistic frameworks that traders use to manage risk and improve decision timing.
Sentiment Analysis in Cryptocurrency Trading
The cryptocurrency market is uniquely sensitive to social sentiment compared to traditional financial markets. Because crypto assets lack the earnings reports, dividend yields, and regulatory clarity of conventional securities, investor psychology plays an outsized role in price formation. **Sentiment analysis** involves monitoring online conversations across platforms like Twitter/X, Reddit, Discord, and Telegram to gauge whether the broader community feels optimistic or pessimistic about a particular asset. Tracking metrics such as social media mention volume, keyword polarity, and forum activity can provide early signals of emerging trends. Major news events — regulatory announcements from the US Securities and Exchange Commission (SEC), institutional adoption news, or high-profile security breaches — can trigger rapid sentiment shifts that move markets within hours. Experienced traders often use sentiment data as a contrarian indicator: extreme bullish sentiment in online communities can signal overheated market conditions, while pervasive fear and negativity may actually signal accumulation opportunities. That said, sentiment analysis should complement rather than replace fundamental and technical research, as social media signals can be easily manipulated through coordinated campaigns.
Risks and Challenges in Cryptocurrency Market Analysis
No discussion of market-analysis in crypto would be complete without a candid look at the risks involved. The most obvious challenge is **volatility**. Cryptocurrencies can experience price swings that dwarf anything seen in traditional stock or bond markets. A single tweet from a prominent figure, an unexpected regulatory action, or a major exchange hack can send prices plummeting or surging within minutes. **Market manipulation** is another serious concern. The relatively low market capitalization of many altcoins makes them vulnerable to pump-and-dump schemes, wash trading, and coordinated social media campaigns designed to artificially inflate prices. **Fake news** and misleading information spread rapidly through crypto communities and can cause panic selling or irrational buying. The regulatory landscape for cryptocurrency in the United States continues to evolve, creating additional uncertainty. New rules from the Financial Crimes Enforcement Network (FinCEN), the SEC, or the Commodity Futures Trading Commission (CFTC) can fundamentally alter the viability of certain tokens overnight. Staying current with reliable information sources and cross-referencing claims before acting on them is essential for anyone serious about navigating this market responsibly.
Practical Applications of Market Analysis for US Readers
Understanding market-analysis principles translates directly into better everyday investment decisions. For US readers building a cryptocurrency portfolio, the most practical starting point is to establish clear goals: Are you investing for long-term appreciation, short-term trading profits, or portfolio diversification? Once goals are defined, applying a layered analysis approach helps manage uncertainty. Begin with fundamental research — evaluate the technology, team, and adoption trajectory of any token you are considering. Layer in technical analysis to identify favorable entry and exit points while managing risk through stop-loss orders. Use sentiment indicators to avoid buying during euphoric peaks or selling during panicked crashes. **Diversification** is one of the most powerful risk management tools available. Spreading investments across different sectors — Layer 1 blockchain networks, DeFi protocols, metaverse projects, and stablecoins — reduces exposure to any single project’s failure. A sample beginner allocation might look like the comparison below:
| Risk Level | Allocation | Example Assets |
|---|---|---|
| High | 10–20% | Small-cap altcoins or newer DeFi tokens |
| Medium | 30–40% | Mid-cap tokens with established use cases |
| Low | 40–60% | Bitcoin (BTC), Ethereum (ETH), USDC, or tokenized securities |
Setting up a portfolio on a reputable US-based cryptocurrency exchange that complies with Know Your Customer (KYC) regulations ensures your assets are held securely and that you can access regulatory protections where applicable. Always store the majority of your holdings in personal wallets rather than exchange balances, and never invest more than you can afford to lose.
Frequently Asked Questions (FAQ)
Q: What is the difference between fundamental analysis and technical analysis?
A: **Fundamental analysis (FA)** evaluates the intrinsic value of a cryptocurrency by examining factors such as the strength of the underlying technology, the competence of the development team, real-world adoption rates, market partnerships, and overall token utility. The goal is to determine whether a project is undervalued or overvalued based on its long-term potential. **Technical analysis (TA)**, by contrast, focuses exclusively on historical price data, trading volume, and chart patterns to predict short-to-medium-term price movements. TA assumes that all known fundamental information is already reflected in the current price, and that patterns in price history tend to repeat. Most experienced analysts use both approaches together for a more complete picture.
Q: How can I use sentiment analysis in my cryptocurrency trading?
A: Sentiment analysis involves tracking online discussions, news coverage, and community activity to gauge the overall mood of the market toward a specific cryptocurrency. US investors can use free tools that monitor Twitter/X mention volume, Reddit forum activity, Google Trends search data, and Fear and Greed Index readings. When sentiment turns extremely bullish — as measured by surging social mentions and elevated Google search interest — it may signal an overheated market due for a correction. Conversely, pervasive fear and negative sentiment can sometimes indicate accumulation opportunities. However, sentiment signals should always be cross-checked against fundamental and technical data, as social media can be manipulated by coordinated groups.
Q: What are some common mistakes to avoid when conducting cryptocurrency market analysis?
A: Several recurring errors trip up even experienced analysts. First, relying on a single analysis method — whether that is TA, FA, or sentiment alone — without triangulating with other data points. Second, chasing FOMO (fear of missing out) during parabolic price moves without validating whether the rally is backed by genuine fundamentals. Third, ignoring regulatory developments, particularly announcements from US agencies like the SEC and CFTC that can dramatically alter the market landscape overnight. Fourth, failing to manage risk by position sizing and using stop-loss orders. Fifth, taking social media posts at face value without verifying sources, since fake news and coordinated pump campaigns are unfortunately common in crypto spaces. Building a disciplined, multi-method research routine is the most effective way to avoid these pitfalls.
Explore more market-analysis guides on our site.
Charting & Exchange Resources
| Platform | Use Case | Key Feature | Fee Model | Action |
|---|---|---|---|---|
| TradingView | Charting & technical analysis | Indicators, multi-timeframe charts | Free / Pro tiers | View Platform |
| Coinbase | Exchange (beginner-friendly) | Simple USD on-ramp, educational tools | Varies by region | View Platform |
| Binance | Exchange (advanced pairs) | Wide altcoin coverage, spot markets | Varies by region | View Platform |
Affiliate Disclosure: This post contains affiliate links. We may earn a commission if you buy through our links, at no extra cost to you. Investment Risk Disclaimer: Cryptocurrency and digital asset markets are highly volatile. This content is for informational and educational purposes only and is not financial, investment, or trading advice. You may lose some or all of your capital. Do your own research and consult a licensed financial advisor before making investment decisions.
Leave a Reply