
Market Analysis: Understanding Volatility Patterns
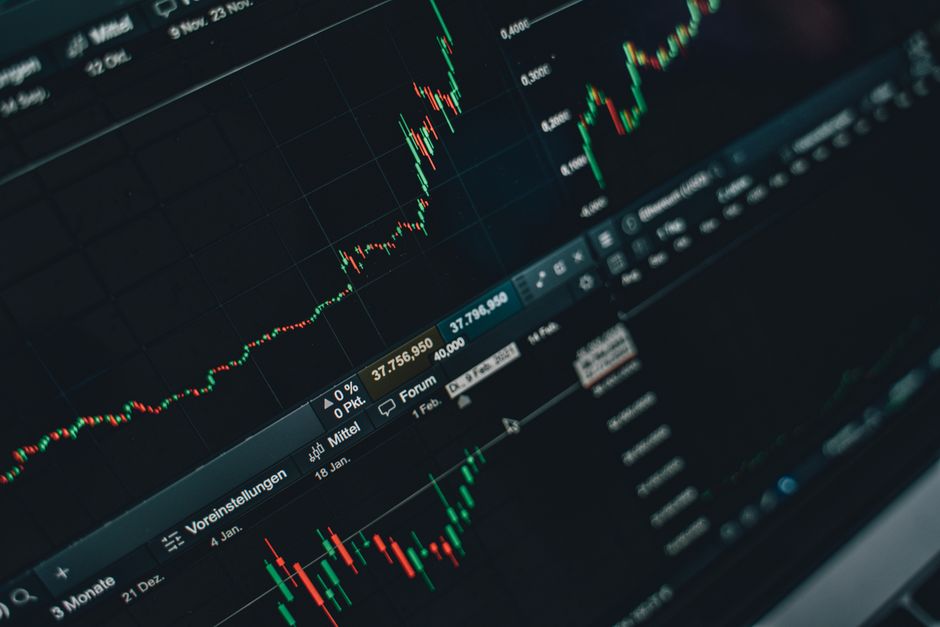

Market Context and Overview
Market volatility has become a defining characteristic of modern financial markets, with dramatic price swings occurring across asset classes from traditional stocks to digital currencies. Recent market conditions have demonstrated how quickly sentiment can shift, creating both opportunities and risks for traders and investors. Understanding **market-analysis** fundamentals is essential for navigating these turbulent waters.
The current trading environment reflects a complex interplay of economic uncertainty, geopolitical tensions, and technological disruption. Major stock indices have experienced significant intraday movements, while cryptocurrency markets continue to exhibit extreme volatility patterns. This heightened market activity underscores the critical importance of developing robust analytical frameworks.

For both institutional and retail participants, comprehending volatility dynamics has become a prerequisite for successful portfolio management. Market participants who fail to account for volatility risk often find themselves unprepared for sudden market reversals or extended periods of uncertainty.
Volatility Metrics and Tools
The **VIX index**, commonly known as the “fear gauge,” serves as the primary benchmark for measuring market volatility expectations in the S&P 500. This index calculates implied volatility from options prices, providing real-time insights into investor sentiment and market stress levels. When the VIX rises above 30, it typically indicates heightened market anxiety and potential for significant price movements.
Beyond the VIX, traders utilize various technical indicators to assess volatility patterns. **Bollinger Bands** help identify periods of low and high volatility by measuring price deviation from moving averages. **Average True Range (ATR)** quantifies daily price movement ranges, enabling traders to set appropriate stop-loss levels and position sizes.
Modern charting platforms offer sophisticated volatility analysis tools including:
- Historical volatility calculators
- Implied volatility rankings
- Volatility surface mapping
- Risk-adjusted return metrics
Factors Influencing Market Volatility
Economic indicators play a crucial role in driving market volatility, with employment data, inflation reports, and central bank decisions creating significant price movements. **Federal Reserve** policy announcements often trigger immediate market reactions as investors reassess interest rate expectations and monetary policy implications. GDP growth figures and consumer confidence surveys also contribute to volatility spikes.
Geopolitical events represent another major volatility catalyst, with international conflicts, trade disputes, and political uncertainty creating market instability. The interconnected nature of global markets means that regional events can quickly spread across asset classes and geographic boundaries. Currency fluctuations often amplify these effects, particularly in emerging markets.
Investor psychology and market sentiment create self-reinforcing volatility cycles. **Fear and greed** emotions drive herd behavior, leading to momentum-driven price movements that can persist longer than fundamental analysis would suggest. Social media and algorithmic trading have accelerated these sentiment-driven moves, creating flash crashes and rapid reversals.
Analyzing Volatility in Different Markets
Stock market volatility analysis requires understanding sector-specific dynamics and correlation patterns between different equity segments. **Technology stocks** typically exhibit higher volatility than utility companies, while small-cap stocks generally show greater price swings than large-cap alternatives. Market capitalization, trading volume, and institutional ownership levels all influence individual stock volatility characteristics.
Cryptocurrency markets demonstrate extreme volatility patterns that dwarf traditional asset classes. **Bitcoin** and other digital assets can experience 10-20% daily price movements during periods of high activity. This volatility stems from regulatory uncertainty, technological developments, and the relatively small market size compared to traditional financial markets.
| Asset Class | Average Daily Volatility | Key Drivers |
|---|---|---|
| Large-Cap Stocks | 1-2% | Earnings, economic data |
| Small-Cap Stocks | 2-4% | Company-specific news |
| Cryptocurrencies | 5-15% | Regulatory news, adoption |
| Commodities | 2-5% | Supply/demand, weather |
Strategies for Managing Market Volatility
**Diversification** remains the cornerstone of volatility management, spreading risk across uncorrelated assets to reduce portfolio-wide volatility. Modern portfolio theory suggests that combining assets with different risk-return profiles can optimize overall portfolio performance while minimizing volatility exposure. Geographic diversification adds another layer of protection against region-specific volatility events.
Hedging strategies using derivatives provide direct volatility protection for existing positions. **Put options** offer downside protection for stock holdings, while **volatility swaps** allow direct trading of volatility itself. Futures contracts enable hedging of commodity and currency exposures that might contribute to portfolio volatility.
Timing strategies focus on entering and exiting positions based on volatility cycles and market conditions. Some approaches include:

- Buying during high volatility periods when assets may be oversold
- Reducing position sizes during uncertainty
- Using volatility breakouts as entry signals
- Implementing systematic rebalancing during volatile periods
Practical Applications and Case Studies
The 2008 financial crisis provides valuable lessons about extreme volatility management and the importance of stress testing portfolios. During this period, correlations between traditionally uncorrelated assets increased dramatically, highlighting the limitations of standard diversification approaches. Investors who maintained adequate cash reserves and avoided excessive leverage were better positioned to weather the storm.
More recent examples include the COVID-19 market crash of March 2020, when the VIX reached historic highs above 80. This event demonstrated how quickly market conditions can deteriorate and the importance of having predetermined risk management protocols. Successful traders during this period focused on **risk management** rather than trying to predict market direction.
Cryptocurrency volatility events, such as the Terra Luna collapse in 2022, illustrate how quickly digital asset markets can experience extreme price movements. These cases emphasize the importance of position sizing and the risks associated with highly leveraged positions in volatile markets.
Risk Disclaimer
**Investment Risk Warning**: Cryptocurrency and financial market investments carry substantial risk of loss. Market volatility can result in significant financial losses, and past performance does not guarantee future results. This content is for educational purposes only and does not constitute financial advice. Always conduct thorough research and consider consulting with qualified financial professionals before making investment decisions. Never invest more than you can afford to lose, especially in highly volatile markets like cryptocurrencies.
Frequently Asked Questions
What is the VIX index and how is it used in market analysis?
The VIX index measures implied volatility in S&P 500 options, reflecting market expectations for volatility over the next 30 days. Traders use VIX levels above 30 to identify periods of market stress and potential buying opportunities. The VIX often spikes during market selloffs and declines during calm periods, making it a valuable contrarian indicator.
How can traders and investors protect their portfolios during periods of high market volatility?
Portfolio protection during volatile periods involves diversification across asset classes, maintaining adequate cash reserves, and using hedging instruments like put options. Position sizing becomes critical, with smaller positions reducing overall portfolio risk. Regular rebalancing helps maintain target allocations and can provide opportunities to buy low and sell high during volatile swings.
What are some common mistakes traders make when analyzing market volatility?
Common volatility analysis mistakes include confusing high volatility with market direction, over-leveraging during uncertain periods, and failing to account for volatility clustering effects. Many traders also mistake short-term volatility spikes for long-term trend changes. Successful volatility analysis requires patience, proper risk management, and understanding that volatility itself can be traded as an asset class.
Explore more market-analysis guides on our site.
Charting & Exchange Resources
| Platform | Use Case | Key Feature | Fee Model | Action |
|---|---|---|---|---|
| TradingView | Charting & technical analysis | Indicators, multi-timeframe charts | Free / Pro tiers | View Platform |
| Coinbase | Exchange (beginner-friendly) | Simple USD on-ramp, educational tools | Varies by region | View Platform |
| Binance | Exchange (advanced pairs) | Wide altcoin coverage, spot markets | Varies by region | View Platform |
Affiliate Disclosure: This post contains affiliate links. We may earn a commission if you buy through our links, at no extra cost to you. Investment Risk Disclaimer: Cryptocurrency and digital asset markets are highly volatile. This content is for informational and educational purposes only and is not financial, investment, or trading advice. You may lose some or all of your capital. Do your own research and consult a licensed financial advisor before making investment decisions.



